
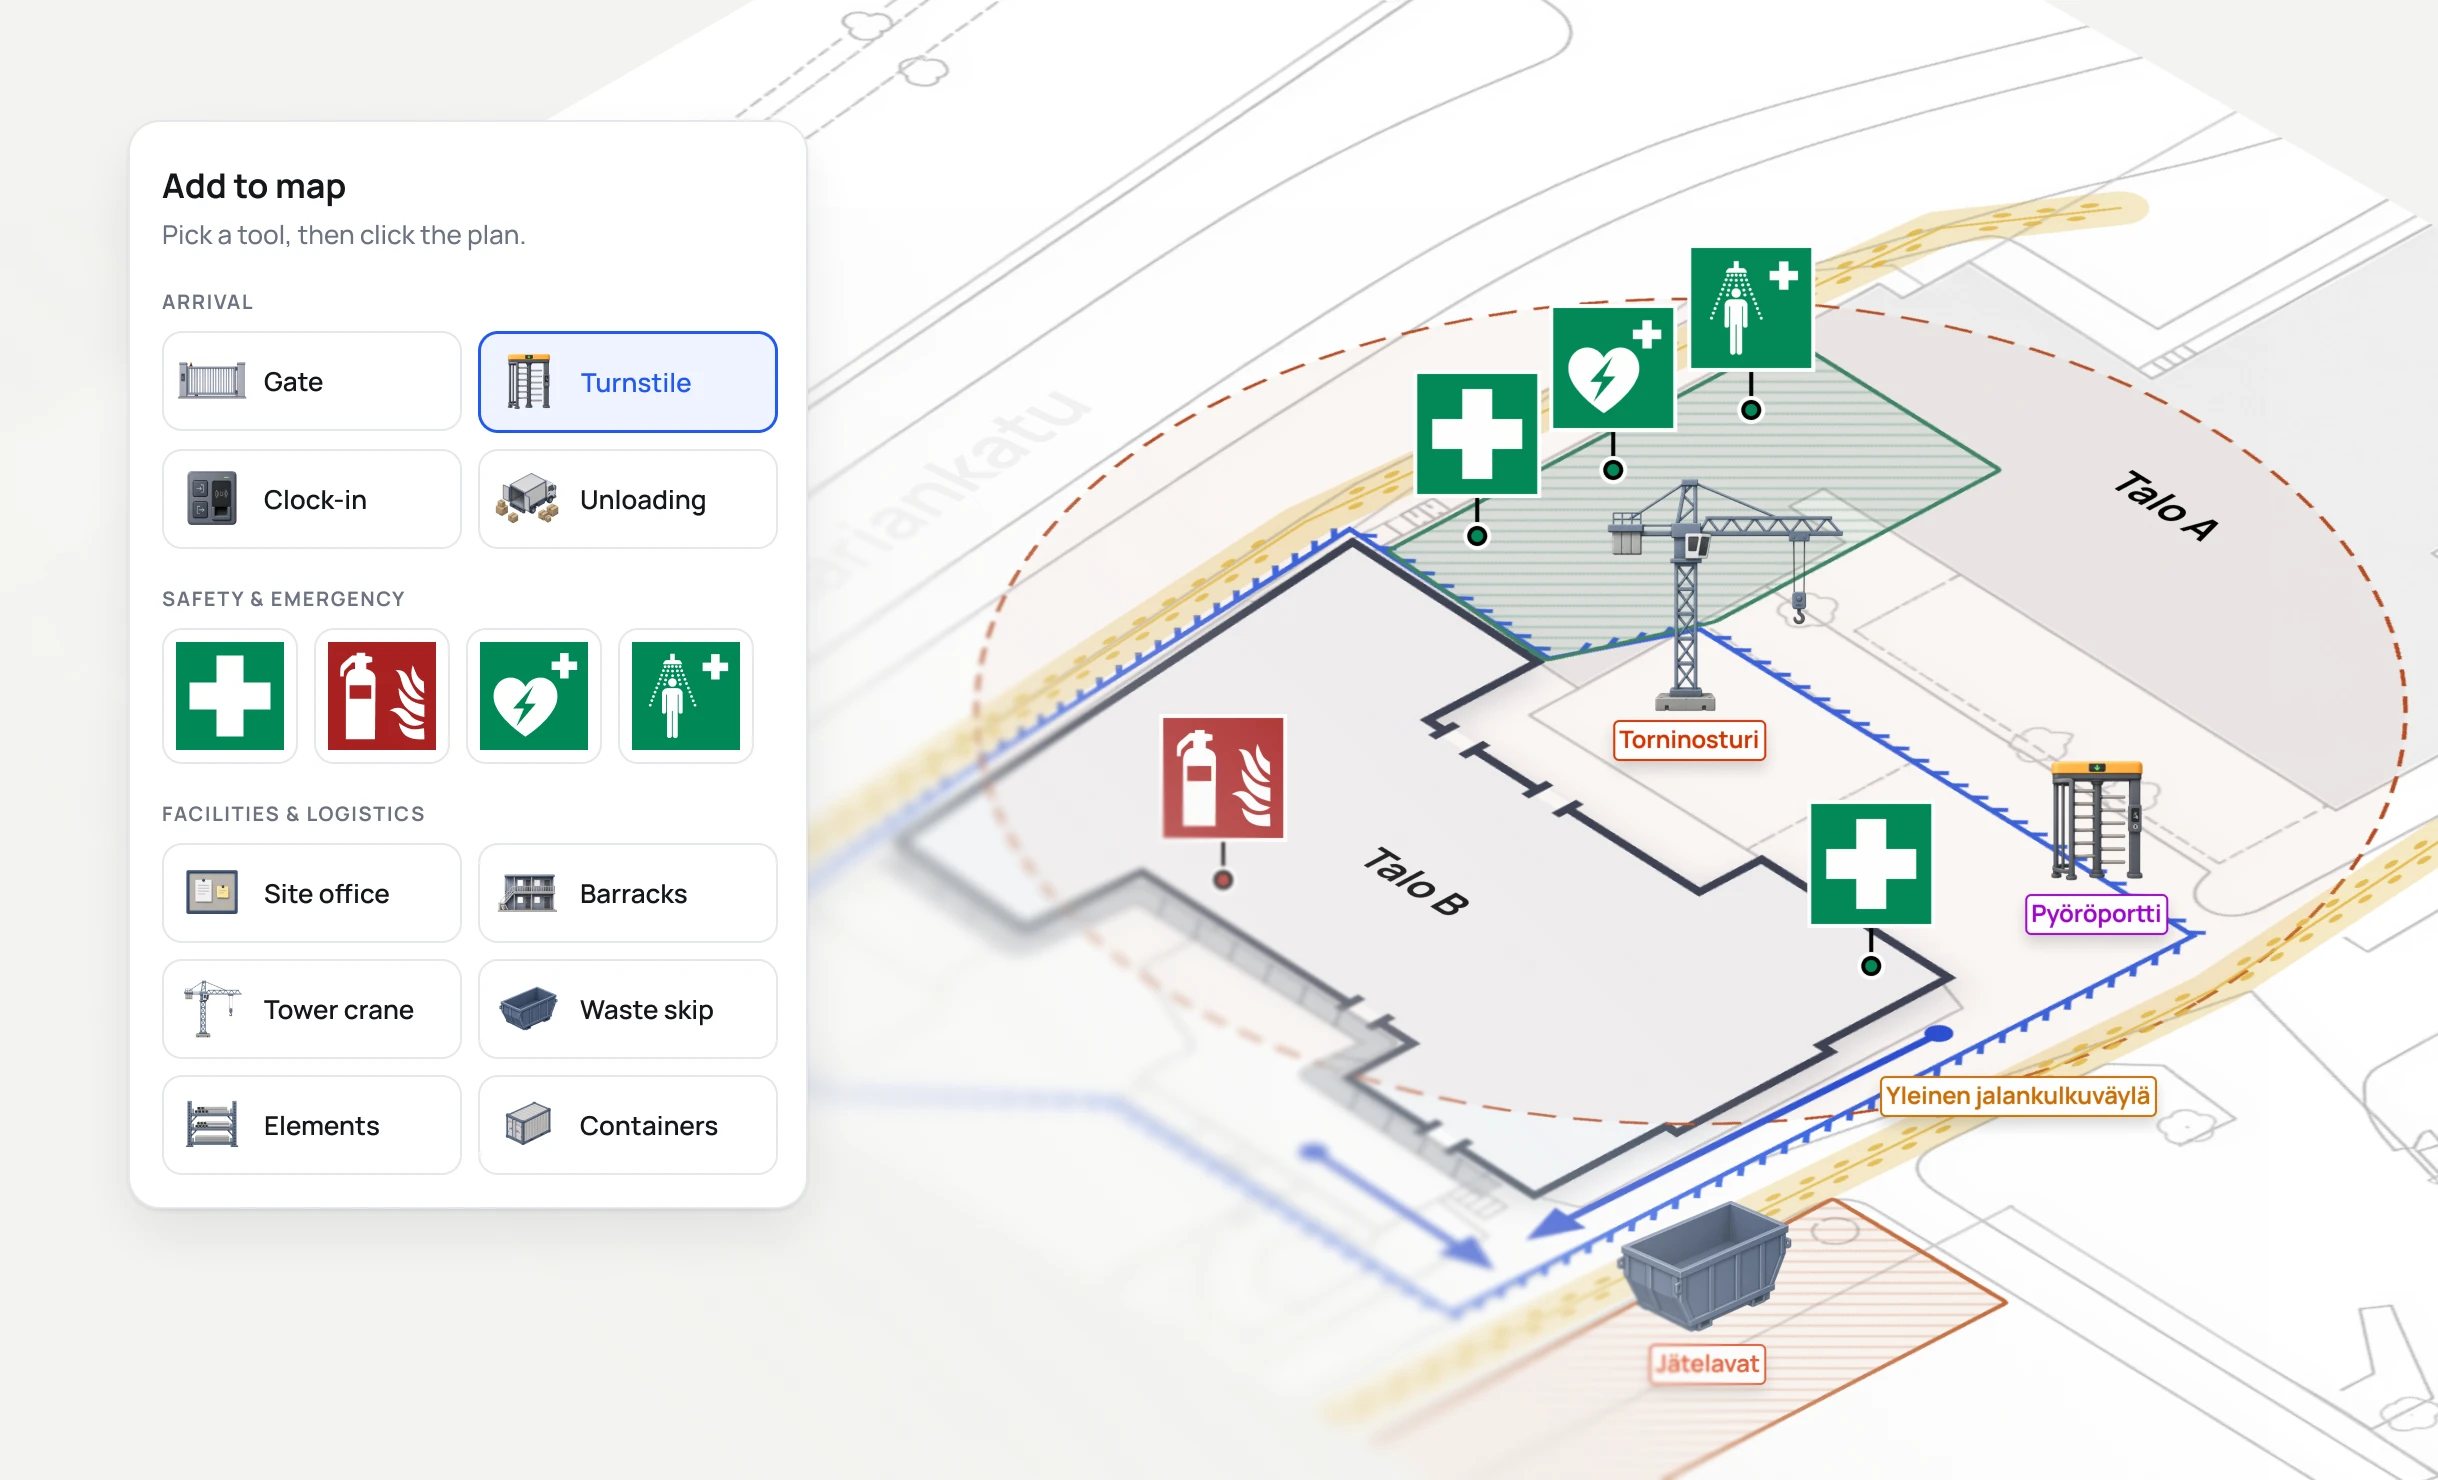
Site plan editor: from Paint pictures to interactive plans
Context
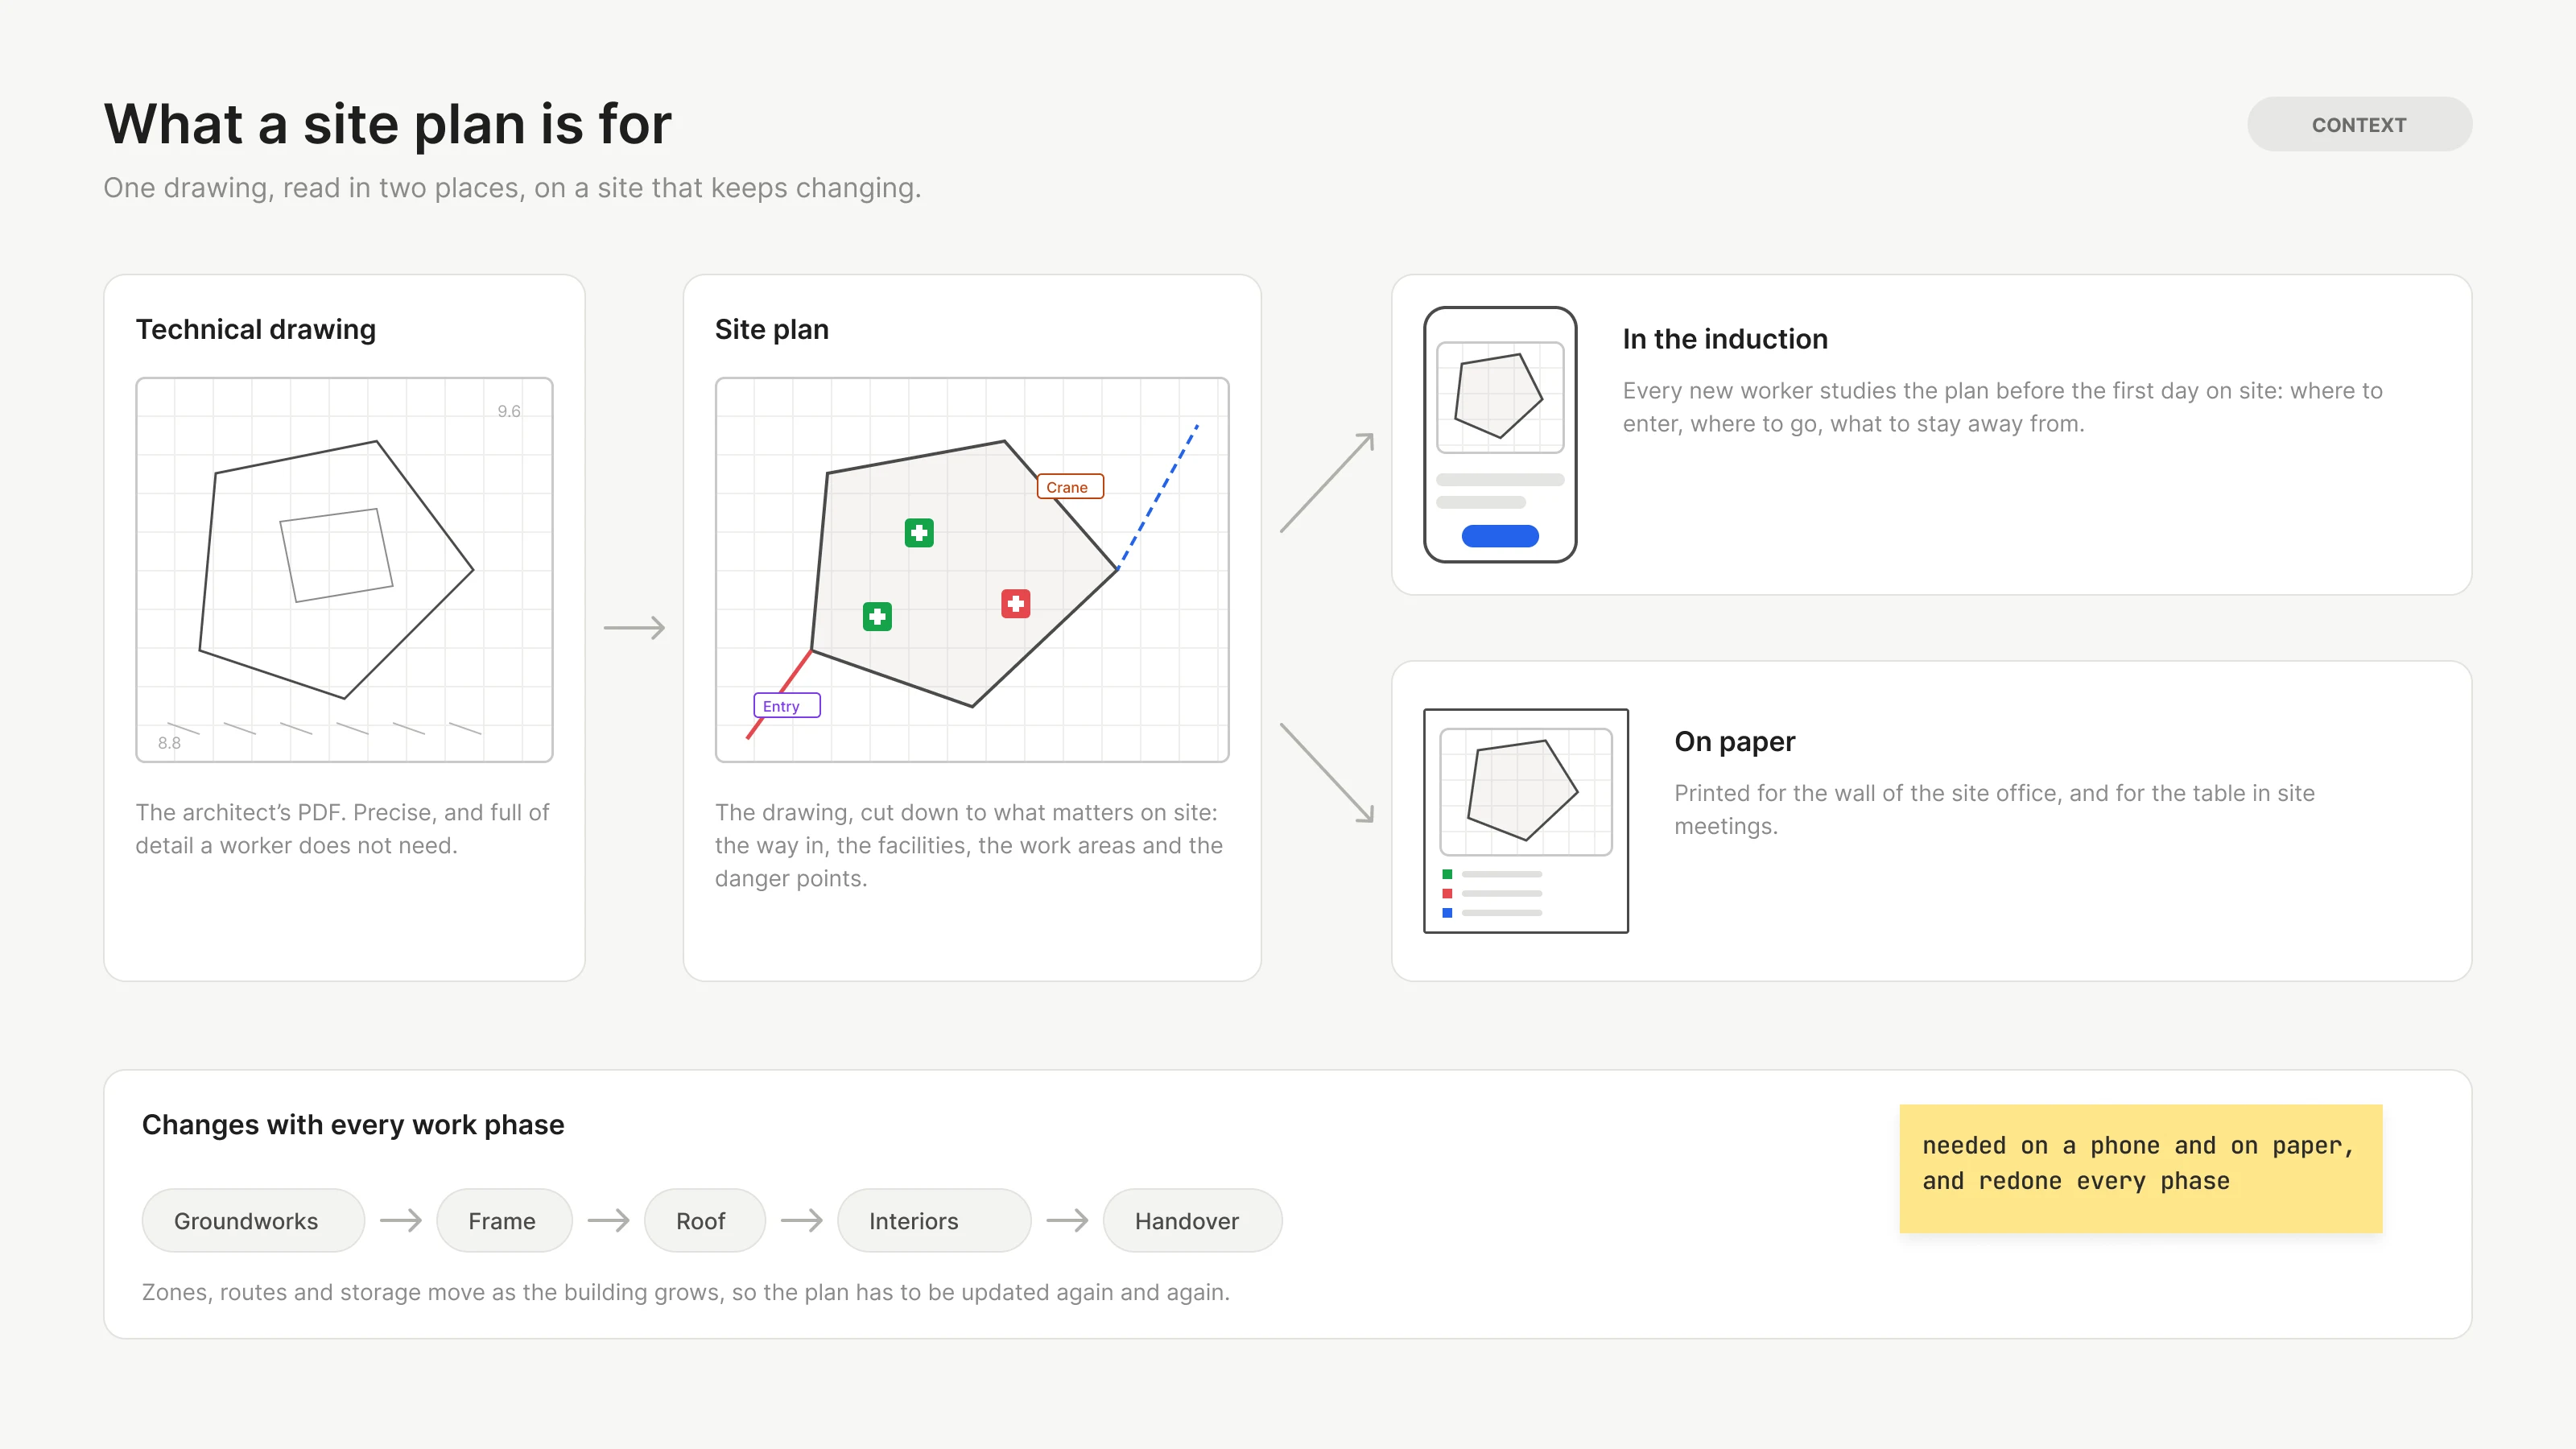
Site plans are everywhere on a construction site. They show where the entrance is, where to go once inside and where the danger points are. Every new worker studies one during induction, and managers print them for the site office wall and for site meetings.
A plan is also never finished. As the building grows, from groundworks to handover, zones, routes and storage areas move, and the plan must follow.
The request came from our customer success lead and the product owner. Customer success was swamped with site plan requests, and there was no clear idea how to make it better.

Before
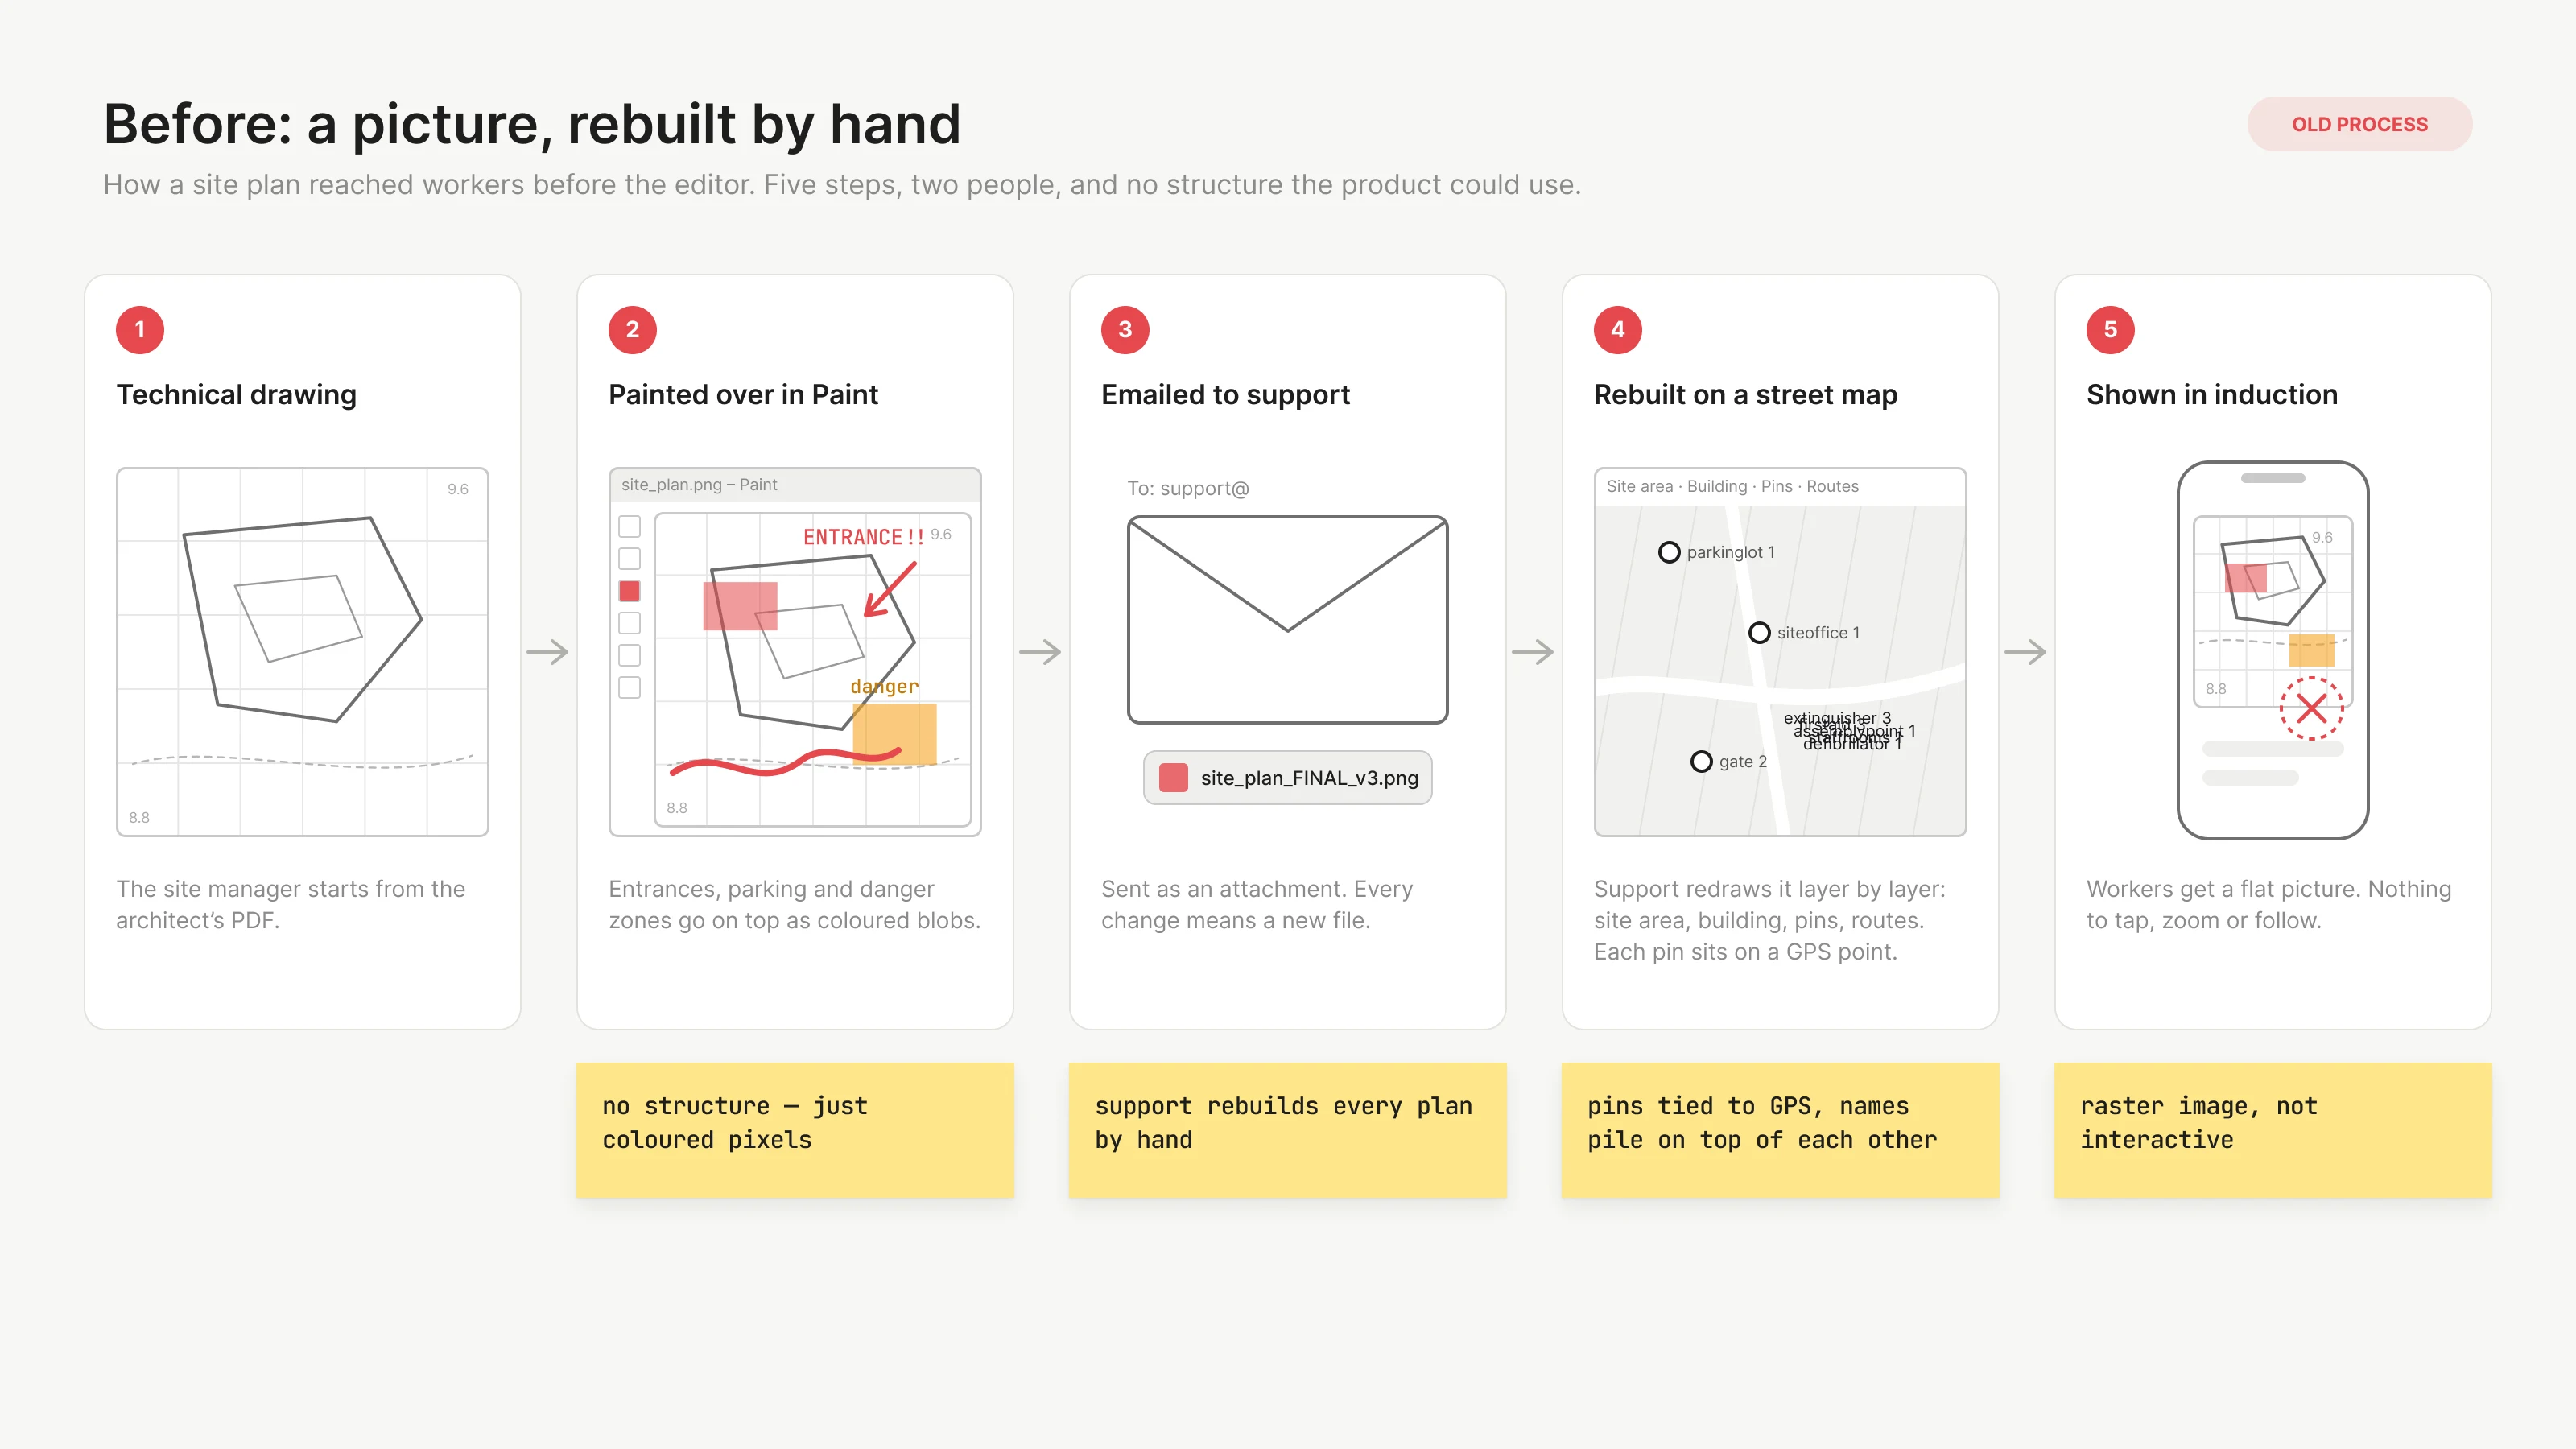
Site managers already drew their own plans: they took the technical drawing and painted markings on top of it in Paint. Then they sent it to our support team, who rebuilt the plan in a Mapbox-based map editor.
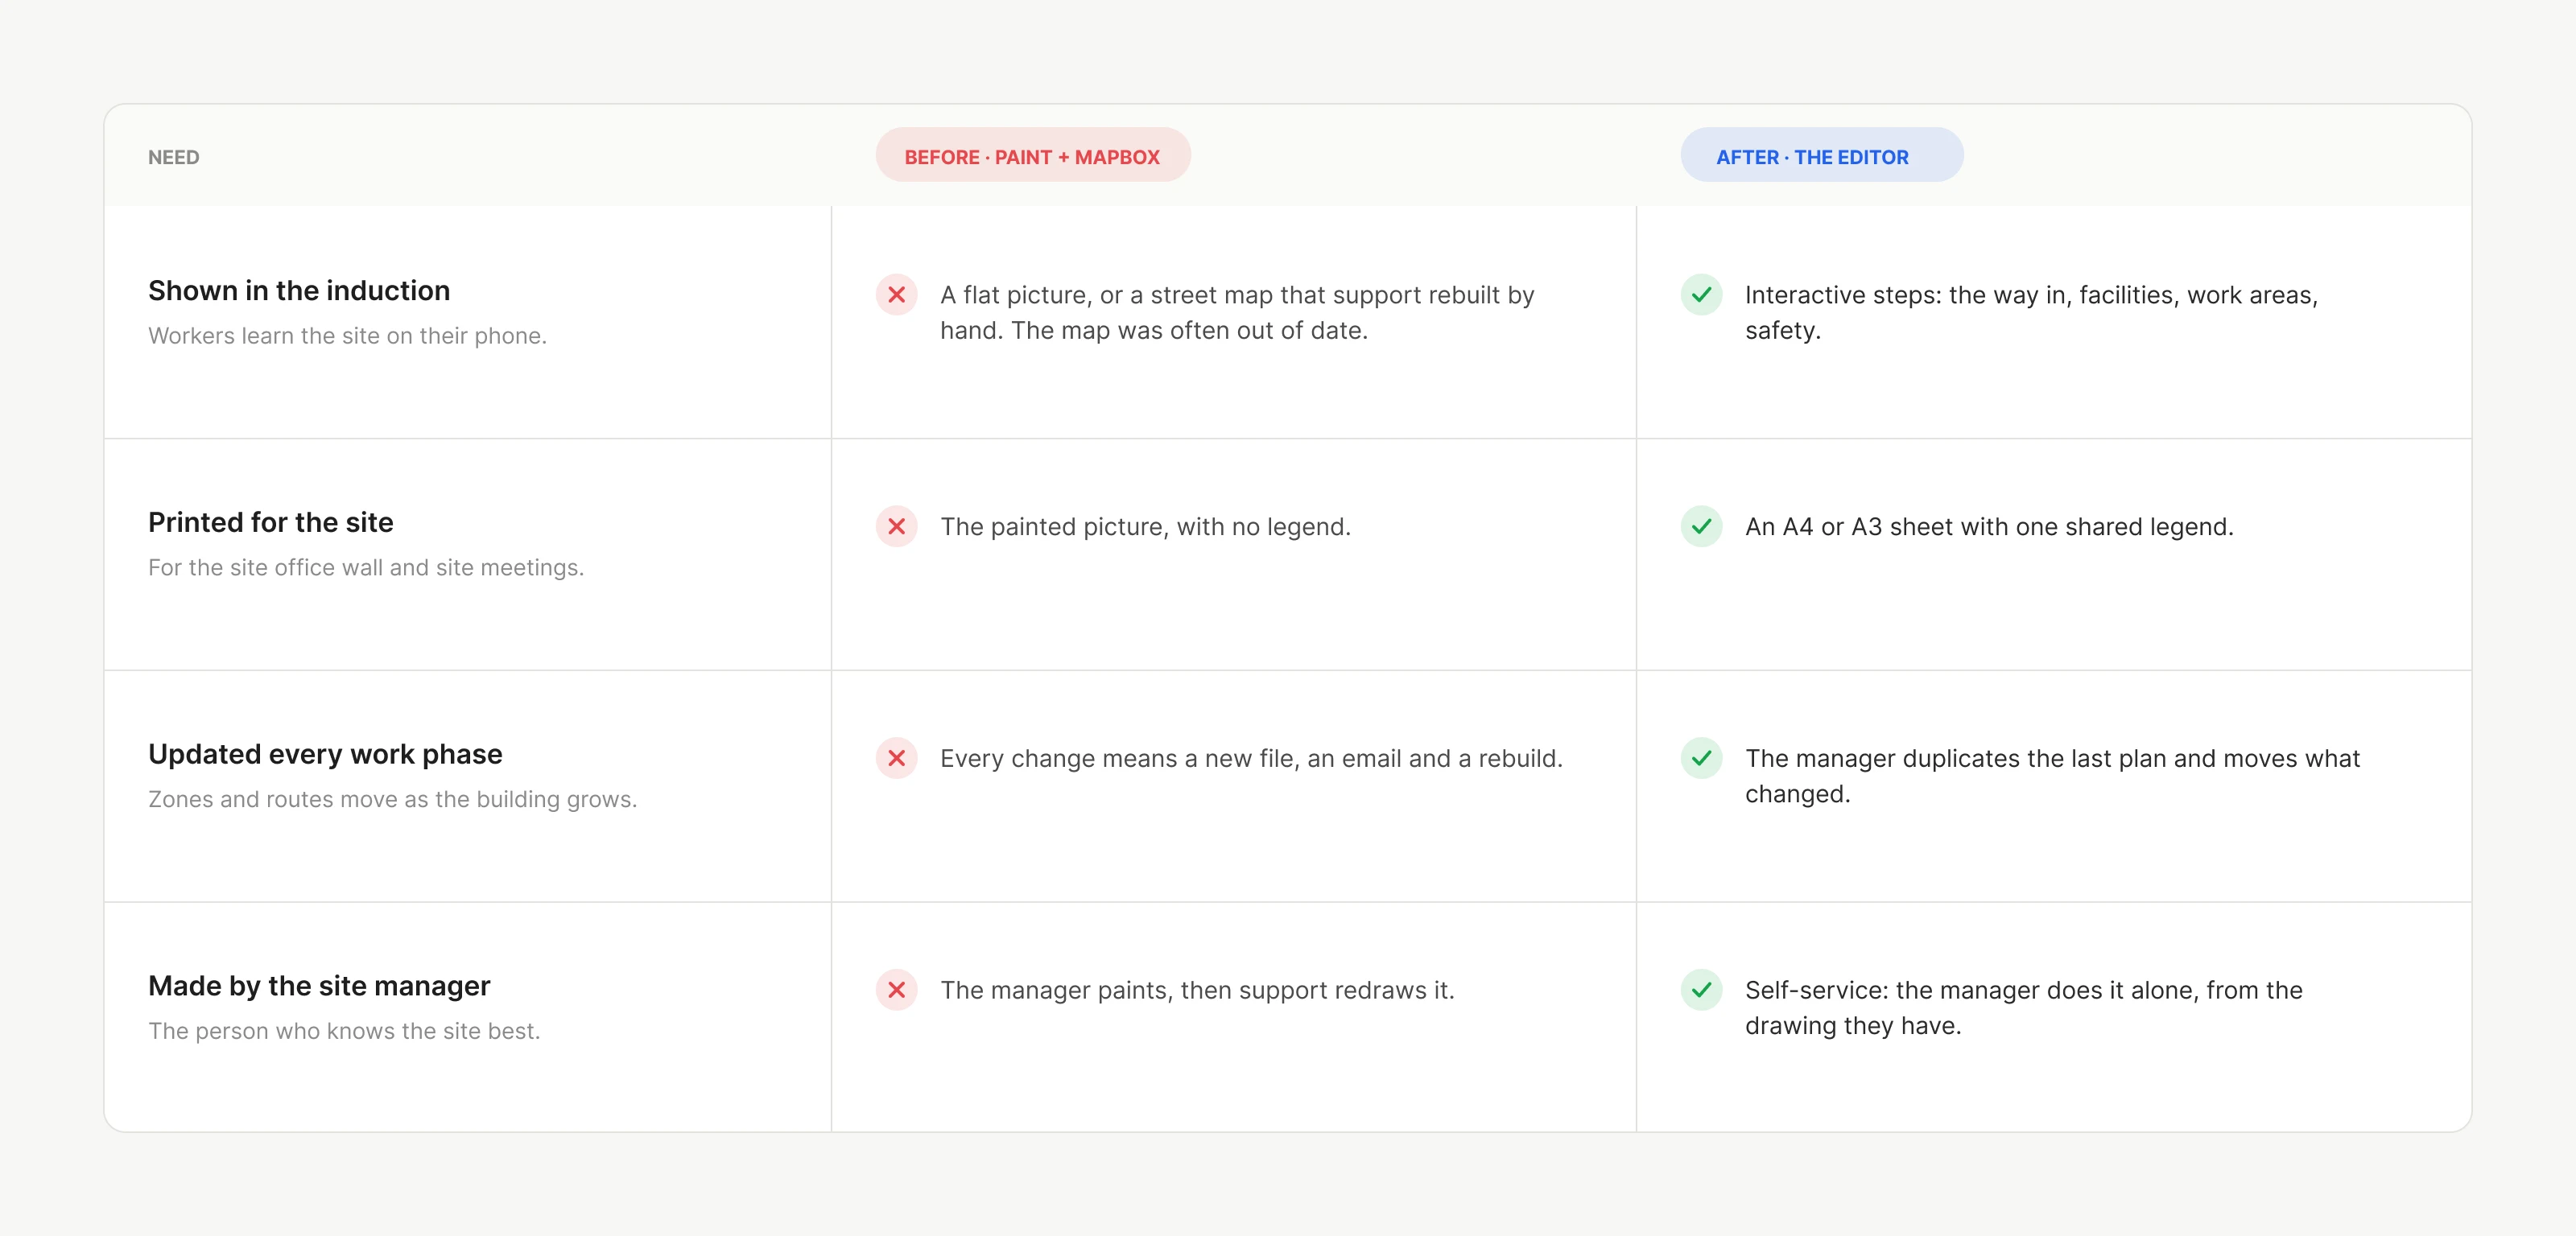
Both halves had a cost. A painted picture is just a raster image: coloured rectangles with no meaning the product can read, so it could not be interactive in induction. And the map editor tied every object to a real geographic position. That precision is hard to maintain, and a site plan does not need it.
The street map was also often wrong for a construction site. It can show a building that was torn down years ago, and it never shows the one that is about to be built. Keeping it usable would have meant constant cleaning of the map data.

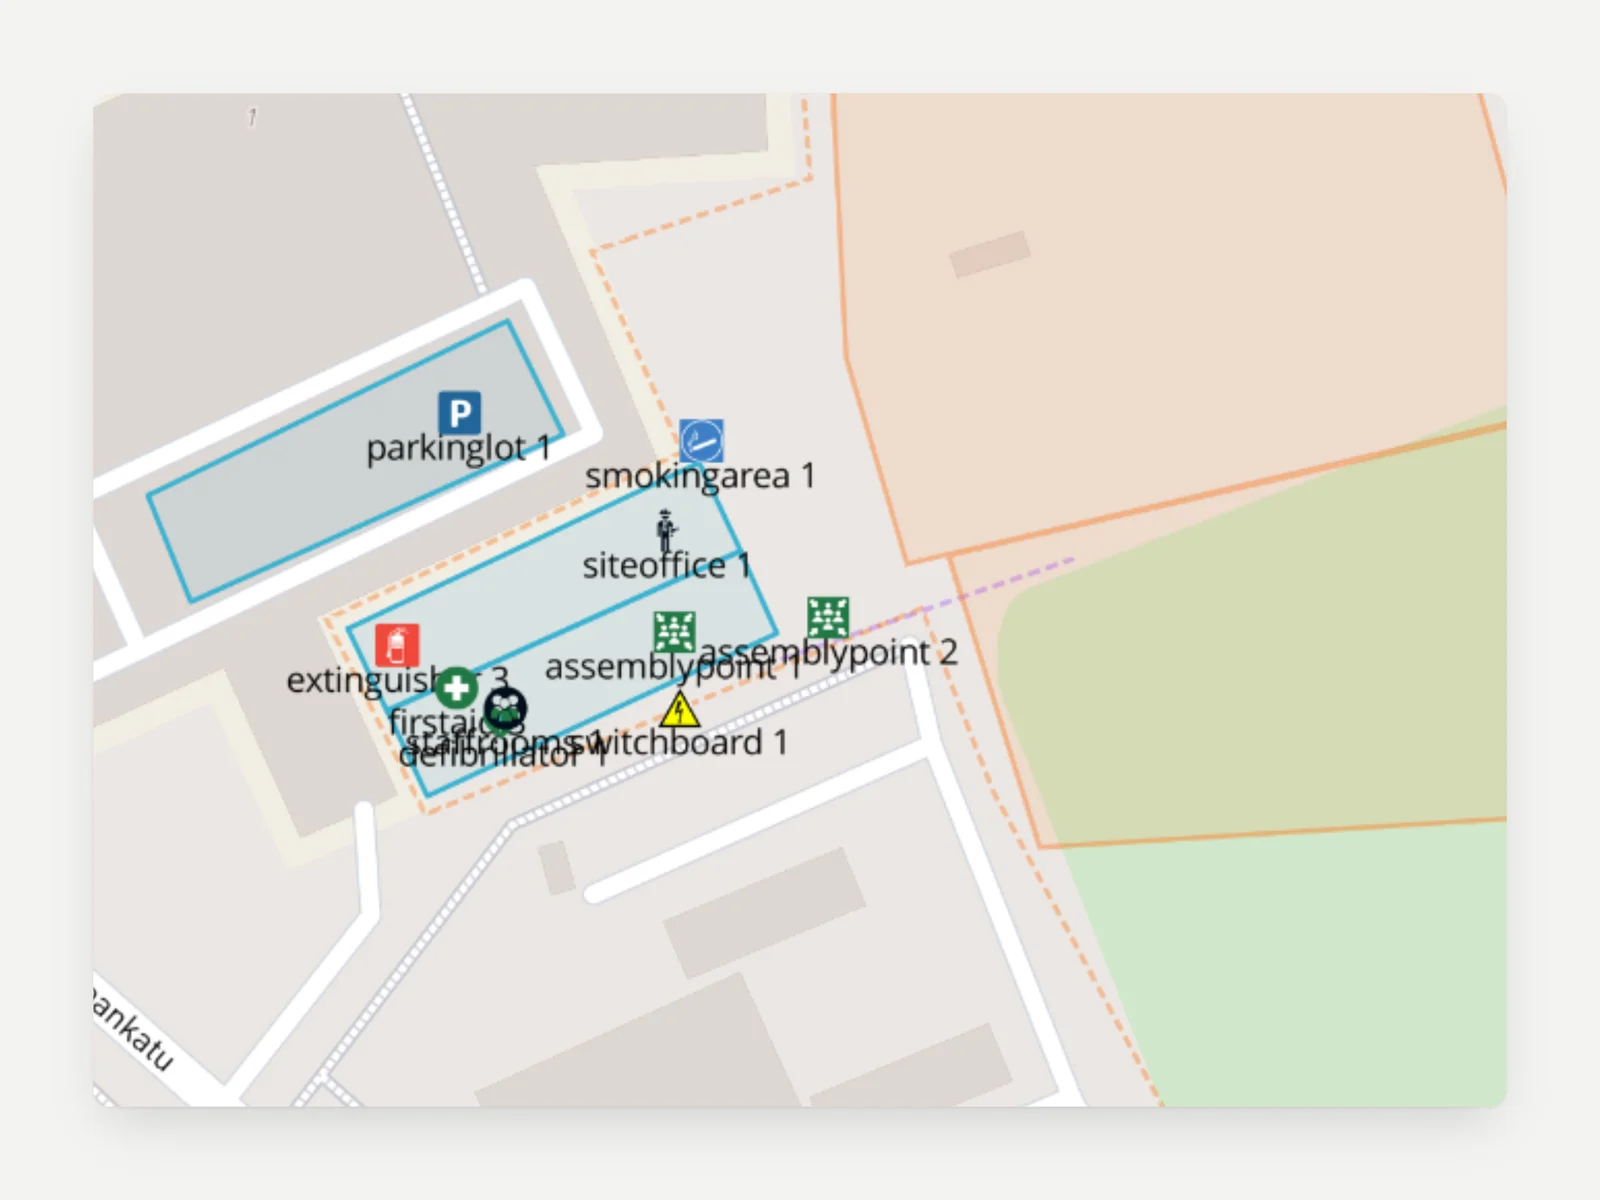
Names on top of names
Each pin sat on a GPS point. Where objects were close together, their names covered each other.

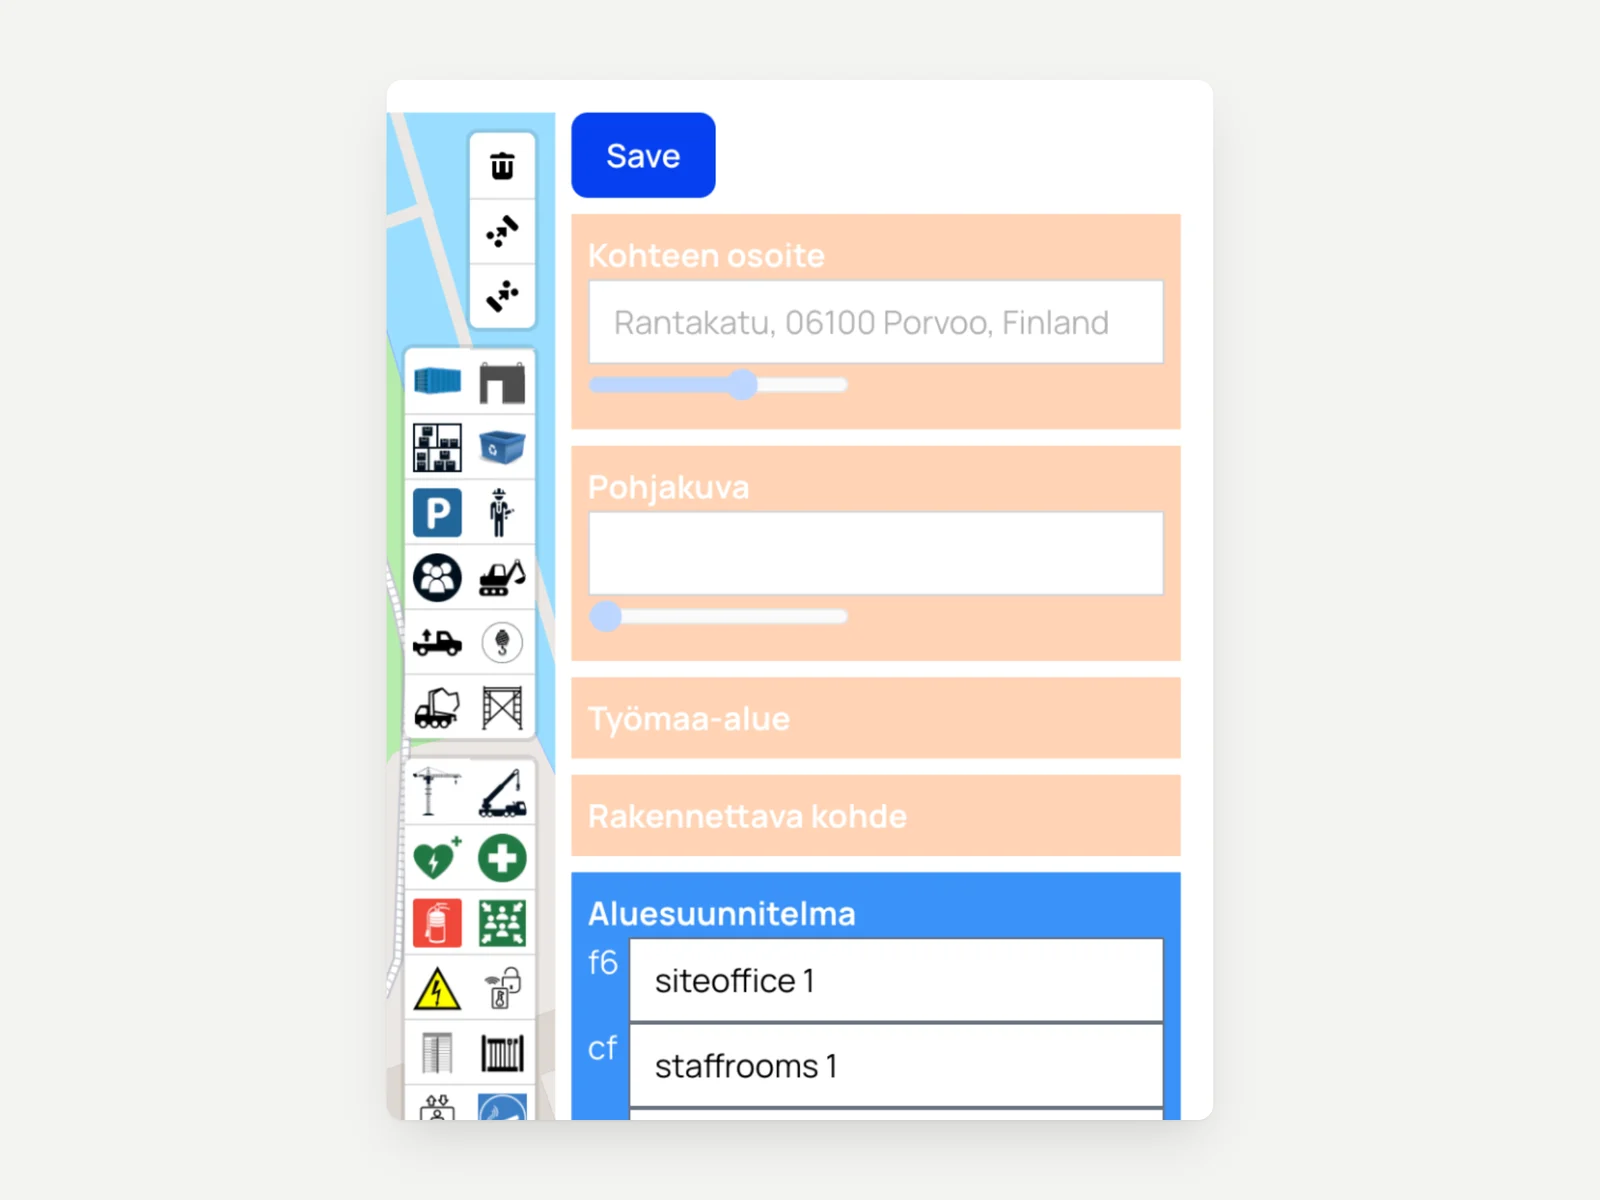
One mode per layer
Support switched between modes for the address, the base image, the site area, the building and the pins. Each pin was a row of text.

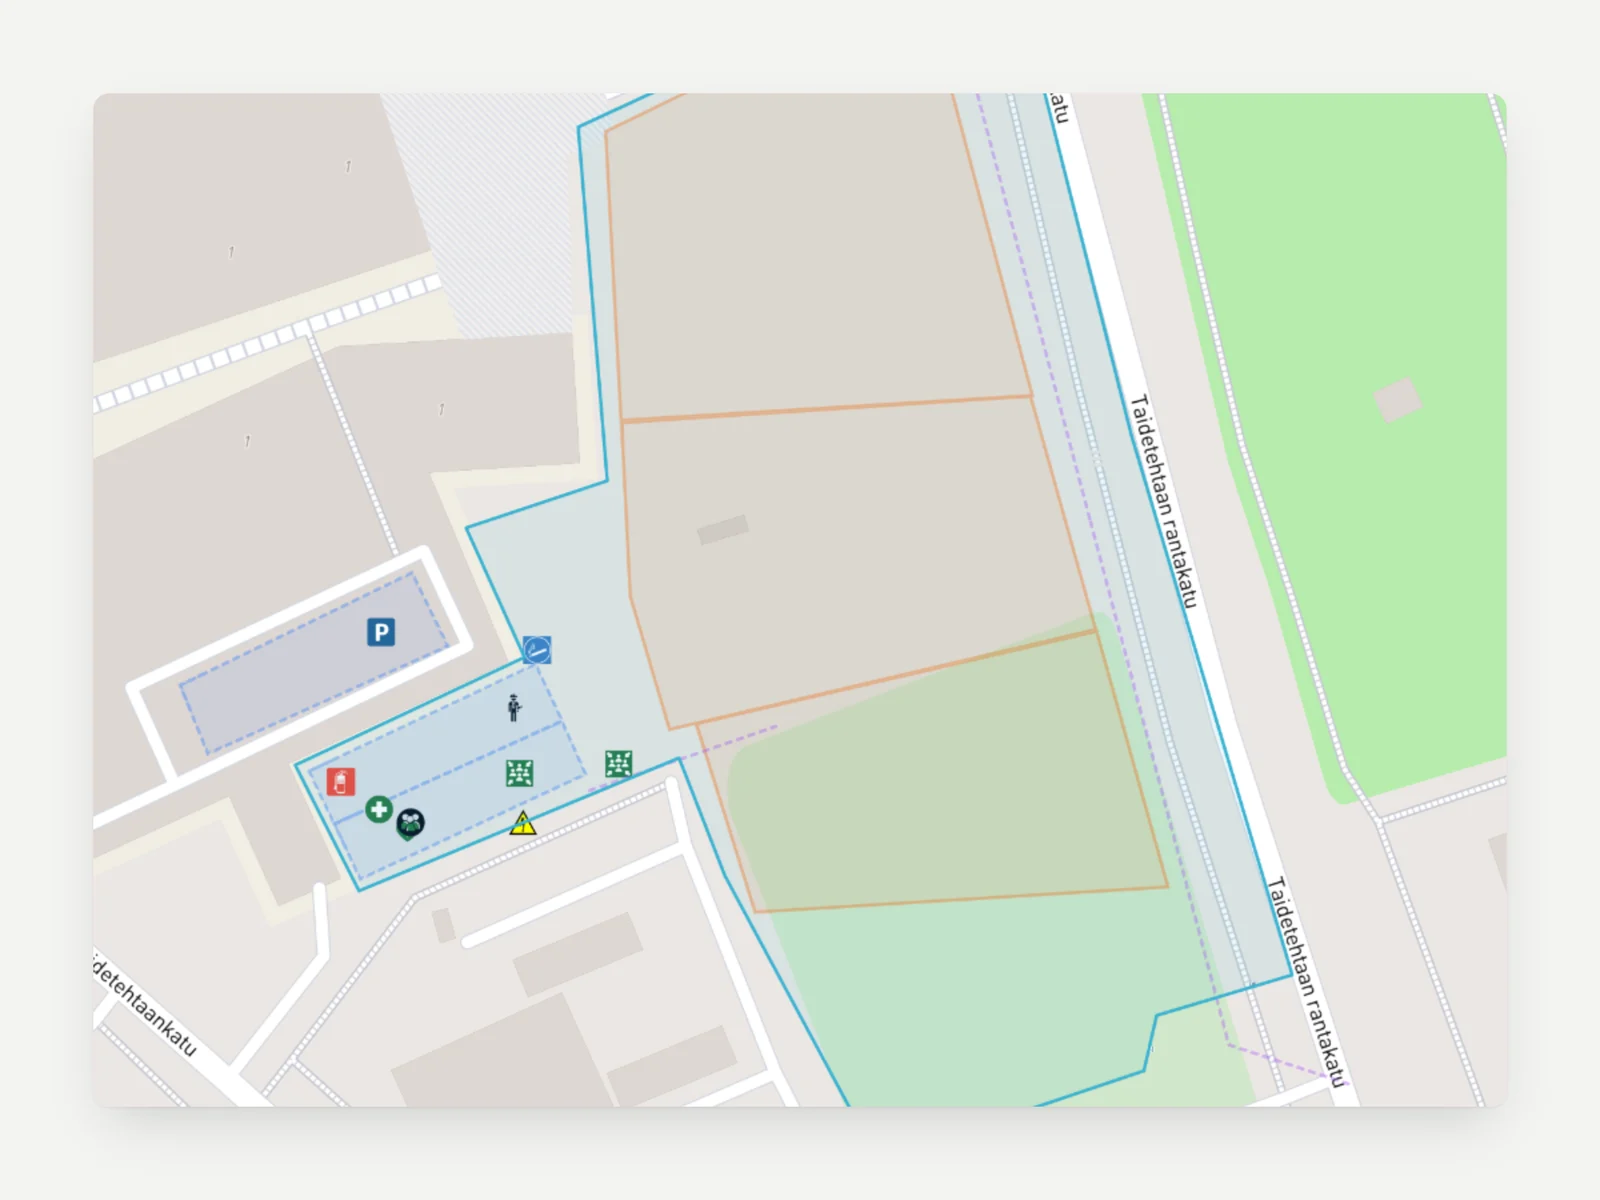
Drawn on a street map
The site area and the building were traced over a street map, not over the drawing the manager already had.

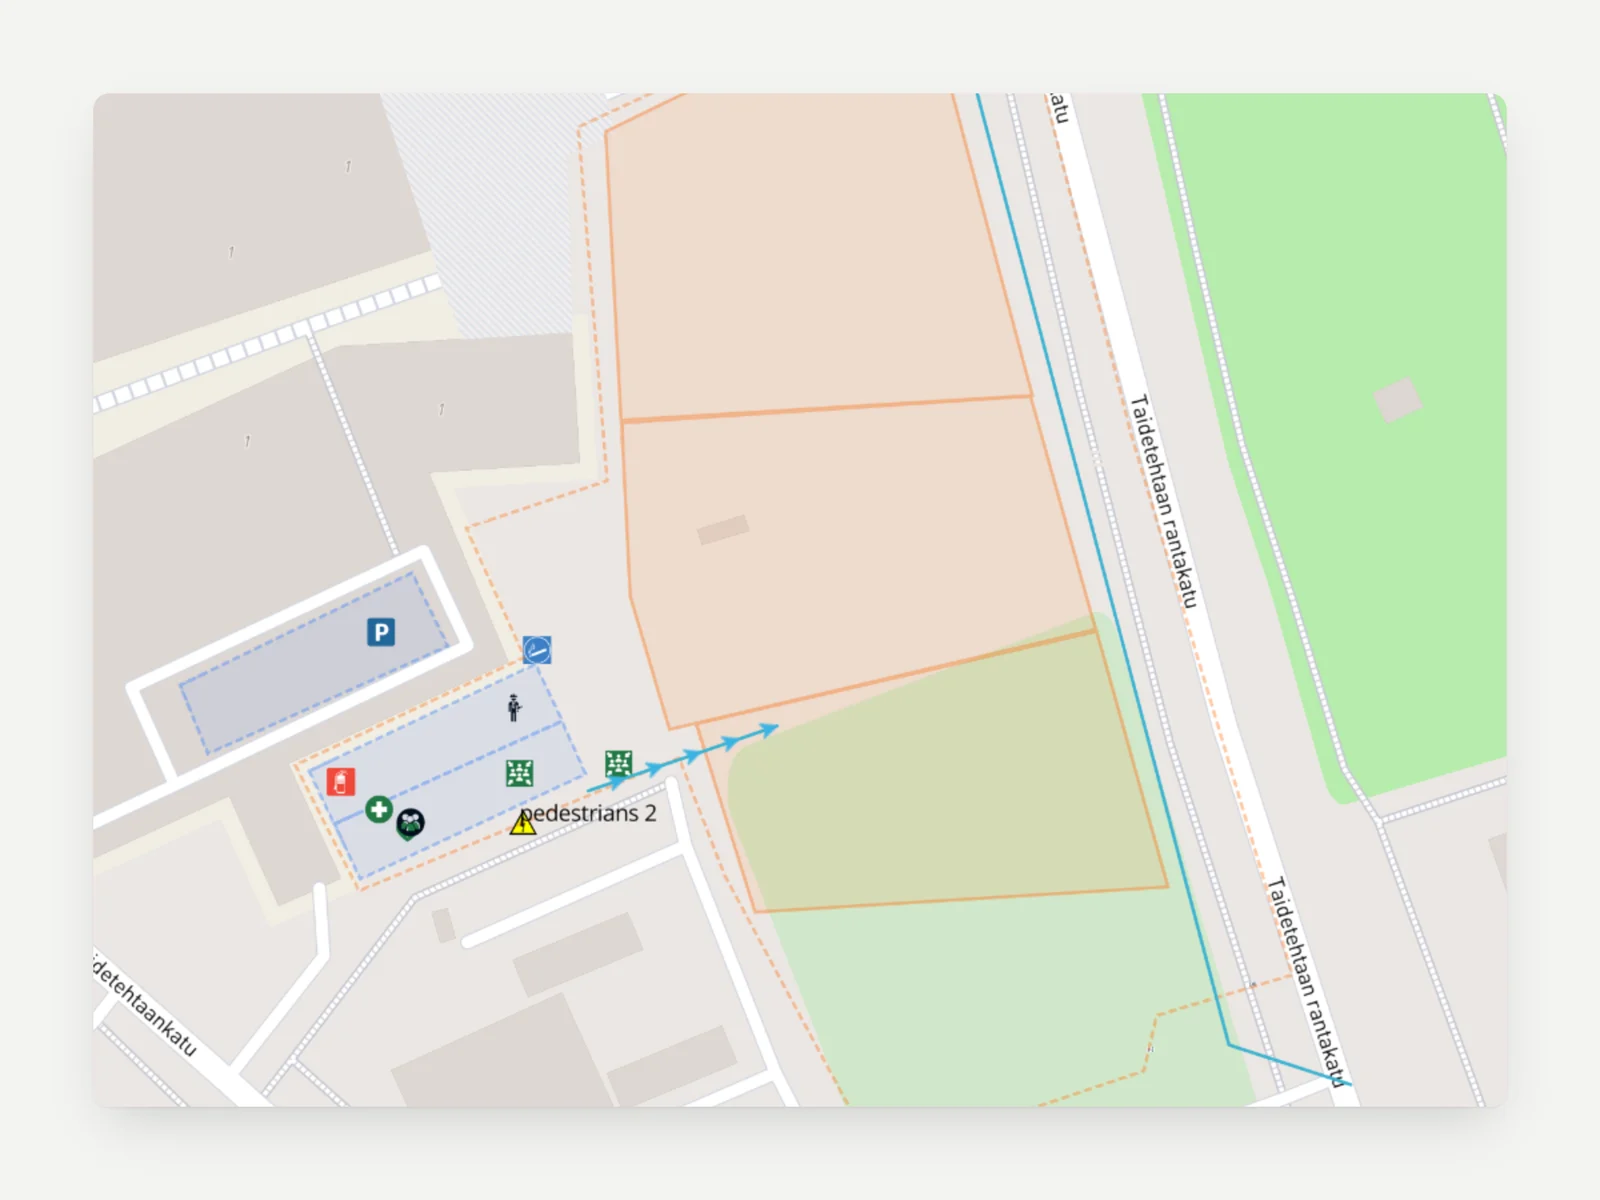
Routes in their own mode
Routes had a separate toolbar. Names showed only in some modes, so the full picture was never on screen.

The new way
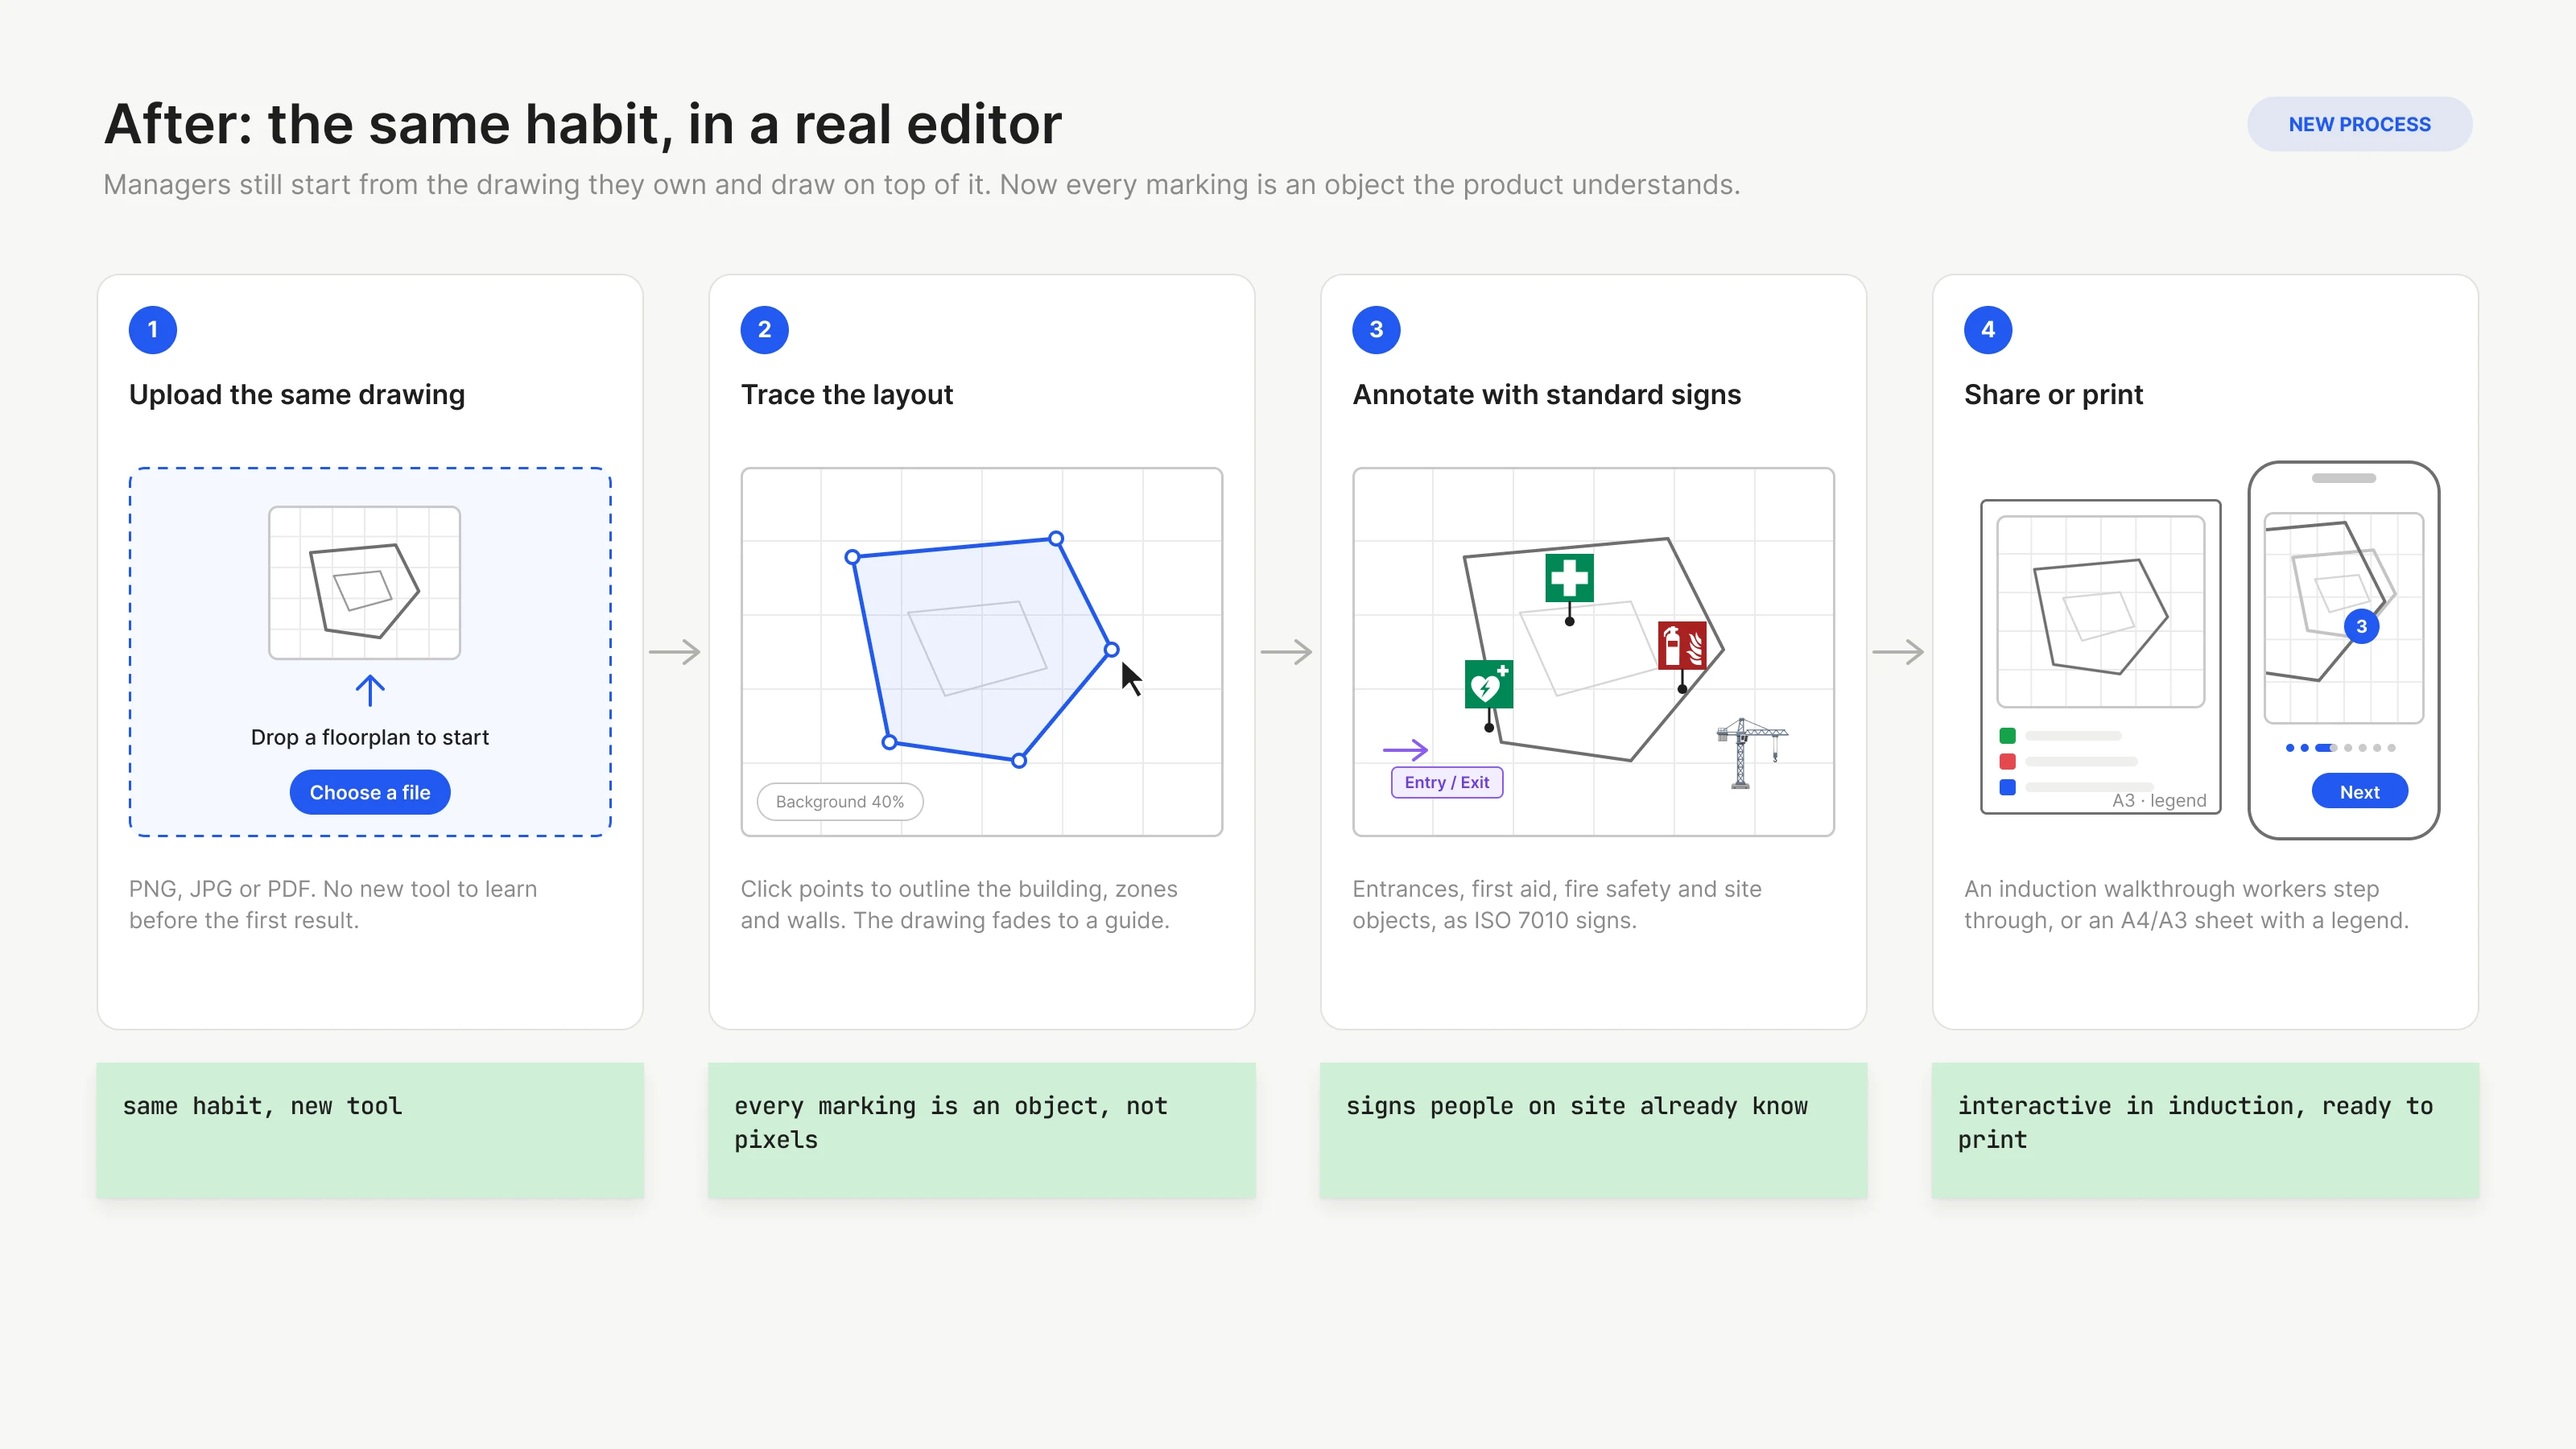
I looked at improving the Mapbox setup, and compared it with a canvas editor built around the process managers had already adopted. The editor was the stronger option. The key decision was to drop Mapbox completely and keep the habit managers already had: start from the plan image they own, and draw on top of it. Only now the drawing happens in our own editor, where every marking is a real object.
Geolocation did not disappear, it moved. Before a worker opens the site plan in the induction, a pin shows the site address on a map, and it opens in the map or navigation app they already know. The plan itself needs no map data, so there is nothing to clean up or keep current.
I did the ideation, the design, the testing and the build: I vibe coded the whole editor on a canvas with React, Konva and react-konva. The editor shares only the site’s name and ID with the rest of the product, and that isolation made security simple to check. The development team connected it to our backend, added the translations and confirmed the data security.


Tested with site managers
I tested the editor with site managers from the first version. Some ideas held: ISO signs were clearly the way to go. Some did not. The first version drew the building and placed the markings in the same step, and that did not make sense to people, so they became two steps. Markers were first split into spots and areas, which was less intuitive than the categories the editor has now. Angular snapping confused people, so it was dropped.
Other features came from requests. Print was not in the first version. Duplication was added so that a new work phase starts from a copy of the last plan. The list of markers grows the same way: managers tell us which items they miss most, and anything rarer goes on an Other label. The latest addition is the elevator.
Principles
- 1No geolocation in the plan. Objects sit on the drawing, not on the globe. The site address still opens in the worker’s own map app.
- 2Trace the image. Start from the drawing the manager already has, and draw on top of it.
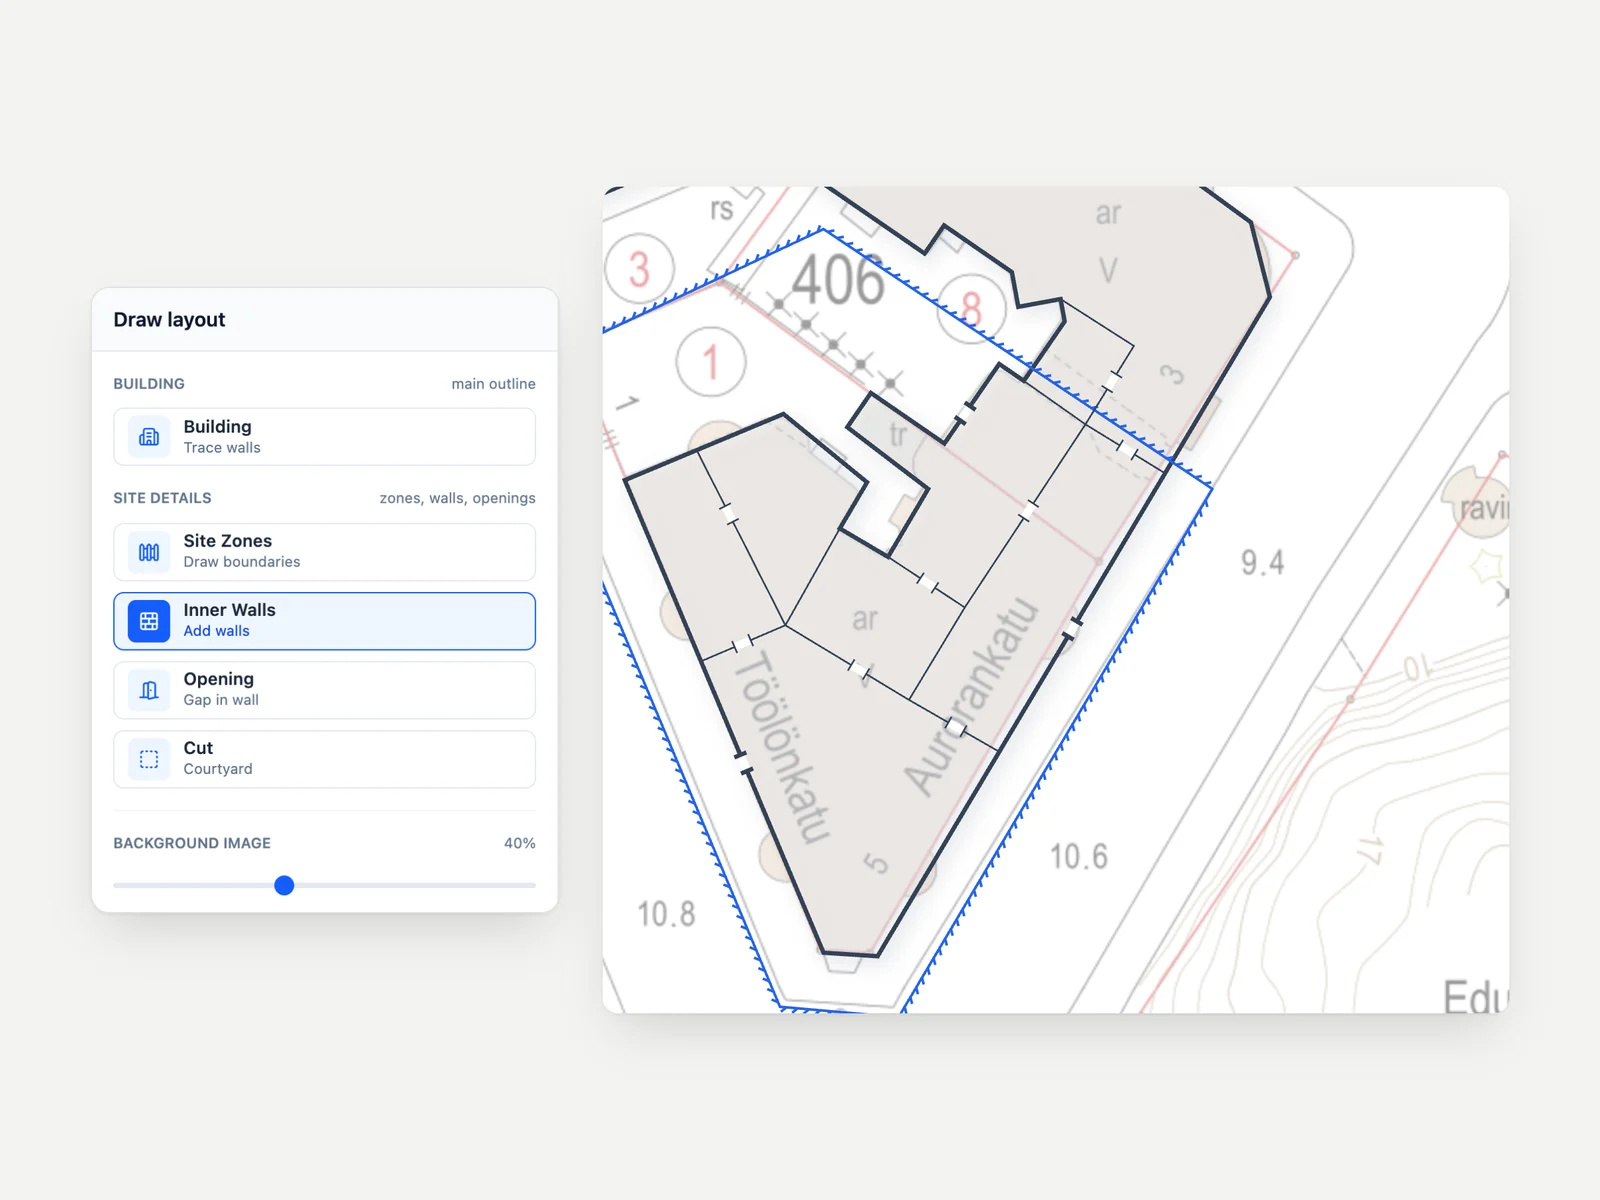
- 3Draw the walls. Outline the building, the site zones and the inner walls, so the plan has real structure.
- 4Annotate. Add entrances, facilities, equipment, routes and safety signs as objects.
- 5Export to print. The same plan becomes an A4 or A3 sheet with a legend, and steps in the induction.
Why a standalone editor
Paint gave managers freedom but no structure. Mapbox gave structure but tied it to a street map and to support. A small editor made for this one job could keep the freedom and add the structure, and it made a lot of small things easier along the way.

Real objects, not pixels
Buildings, walls and openings are vector shapes. A manager can select one, drag the whole shape or fix one corner, and nothing has to be redrawn.
Snapping to walls
An inner wall starts and ends on the outline. An opening sticks to the nearest wall. The plan stays clean without precise clicks.

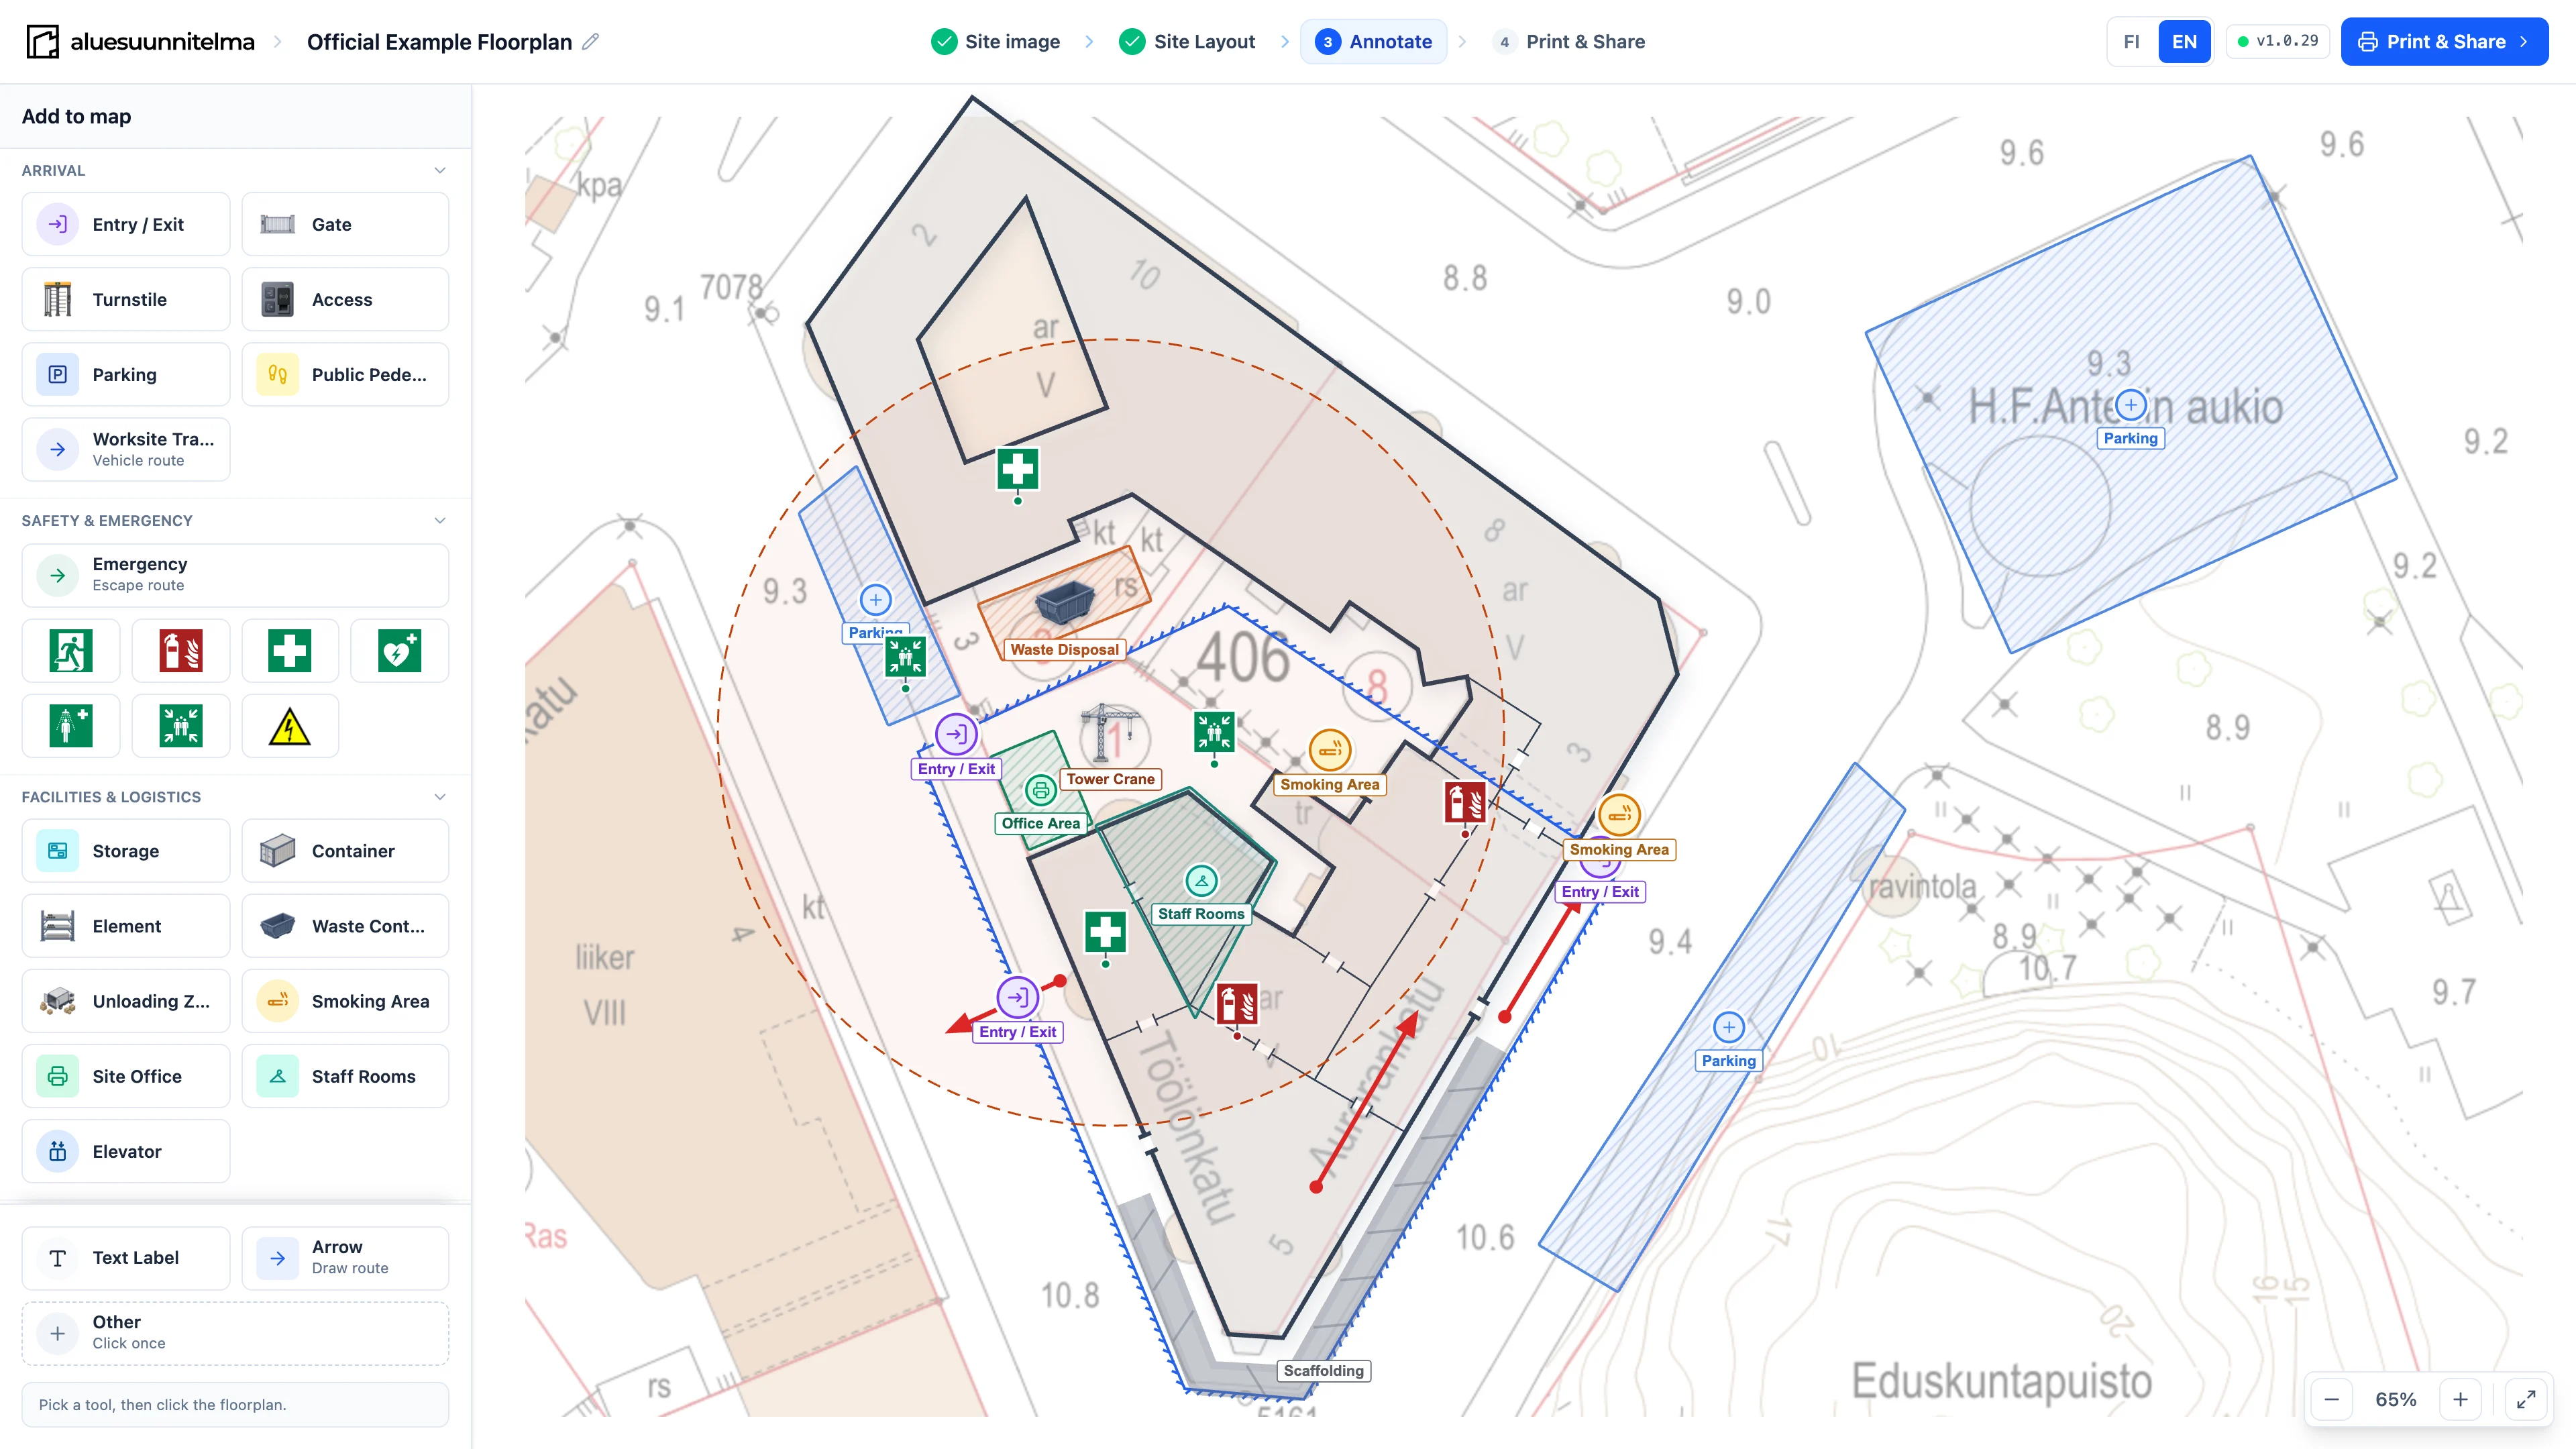
Markers keep their size on screen while the plan zooms, and lines adapt to the zoom, so a plan is readable as an overview and up close. Plans are saved in the browser, the drawing behind them can be faded to a guide, and the editor works in Finnish and in English. Before a new drawing replaces an old one, the editor asks first.
Markers people recognise
A site plan is read in a hurry, often by someone new to the site. So the markers come in three kinds, and each kind has its own job.
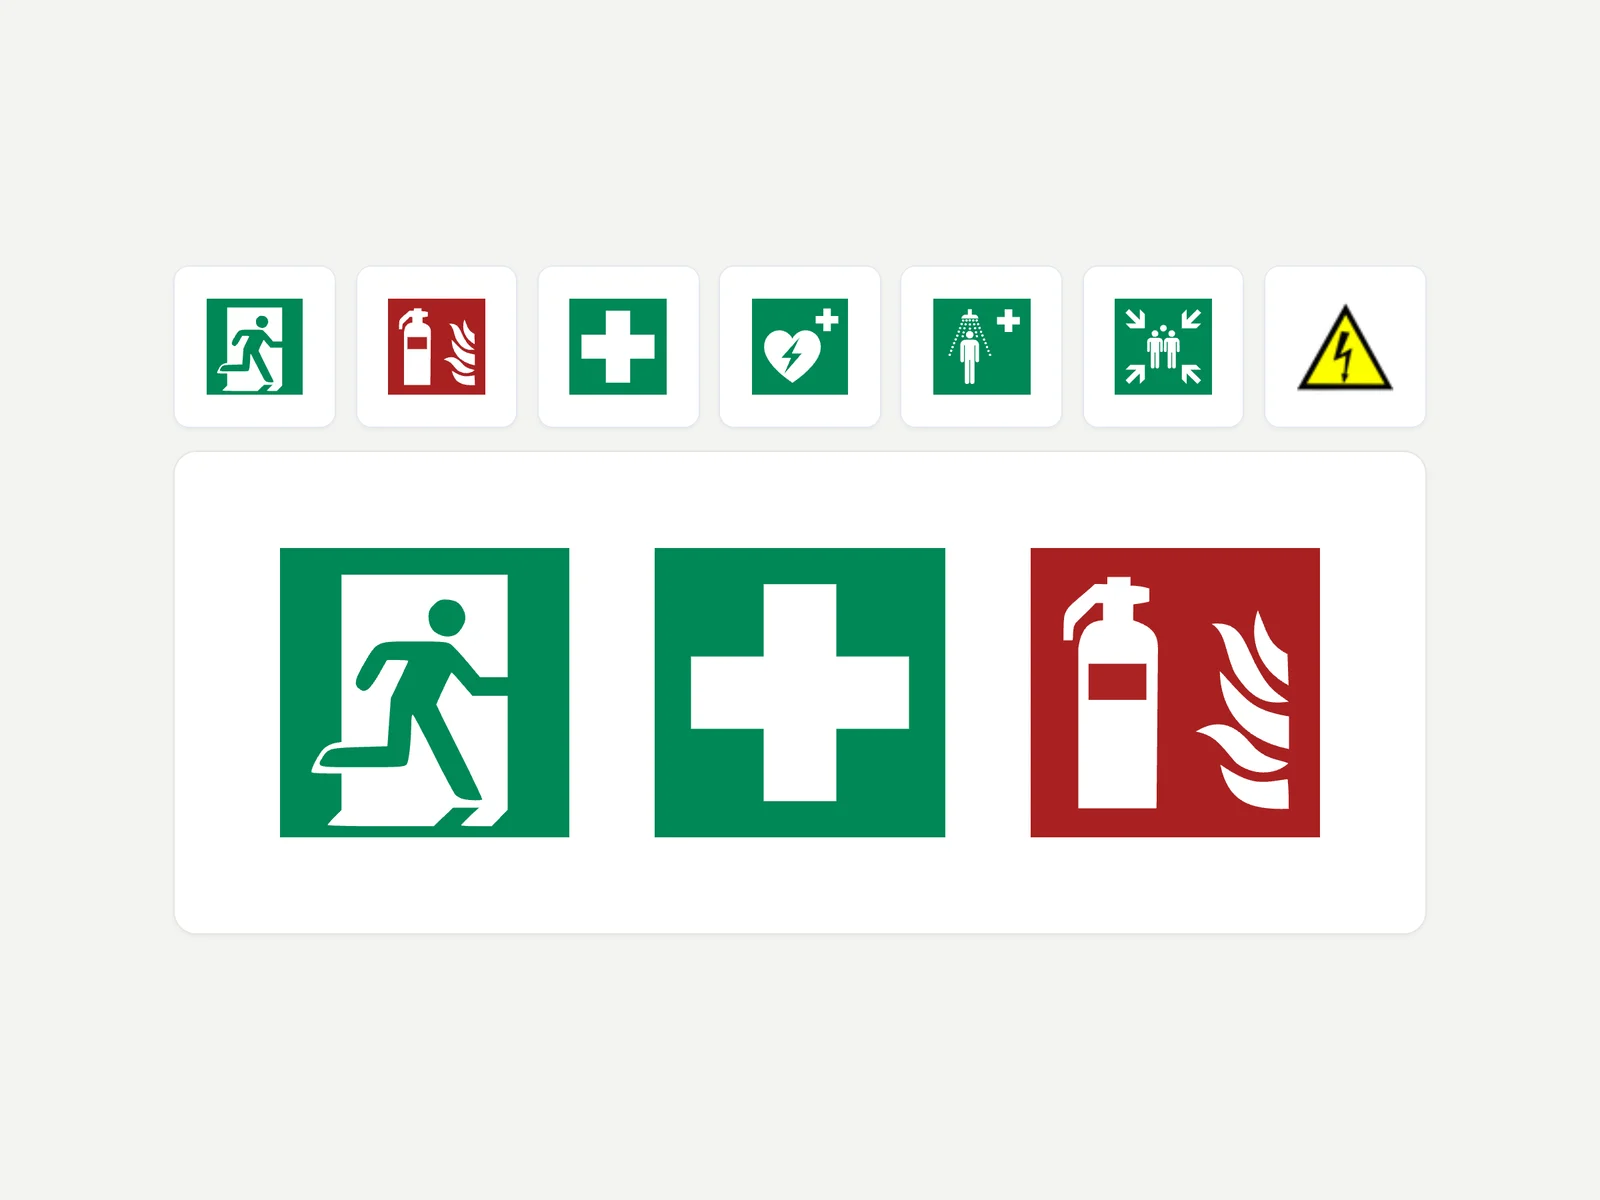
Where a standard exists, the plan uses it: ISO safety signs. Many objects have no ISO sign, and it is not our place to invent one for a tower crane or a concrete pump. Large objects like turnstiles and gates need more detail than a small icon gives, or they look like any entrance, so they are illustrations. Twenty illustrations for everything would feel odd, so small objects keep plain icons. The mix leaves room to grow towards fifty items.

Standard safety signs
Fire, first aid and emergency markers use ISO 7010 signs. Workers already know them from the site, so the plan feels familiar.

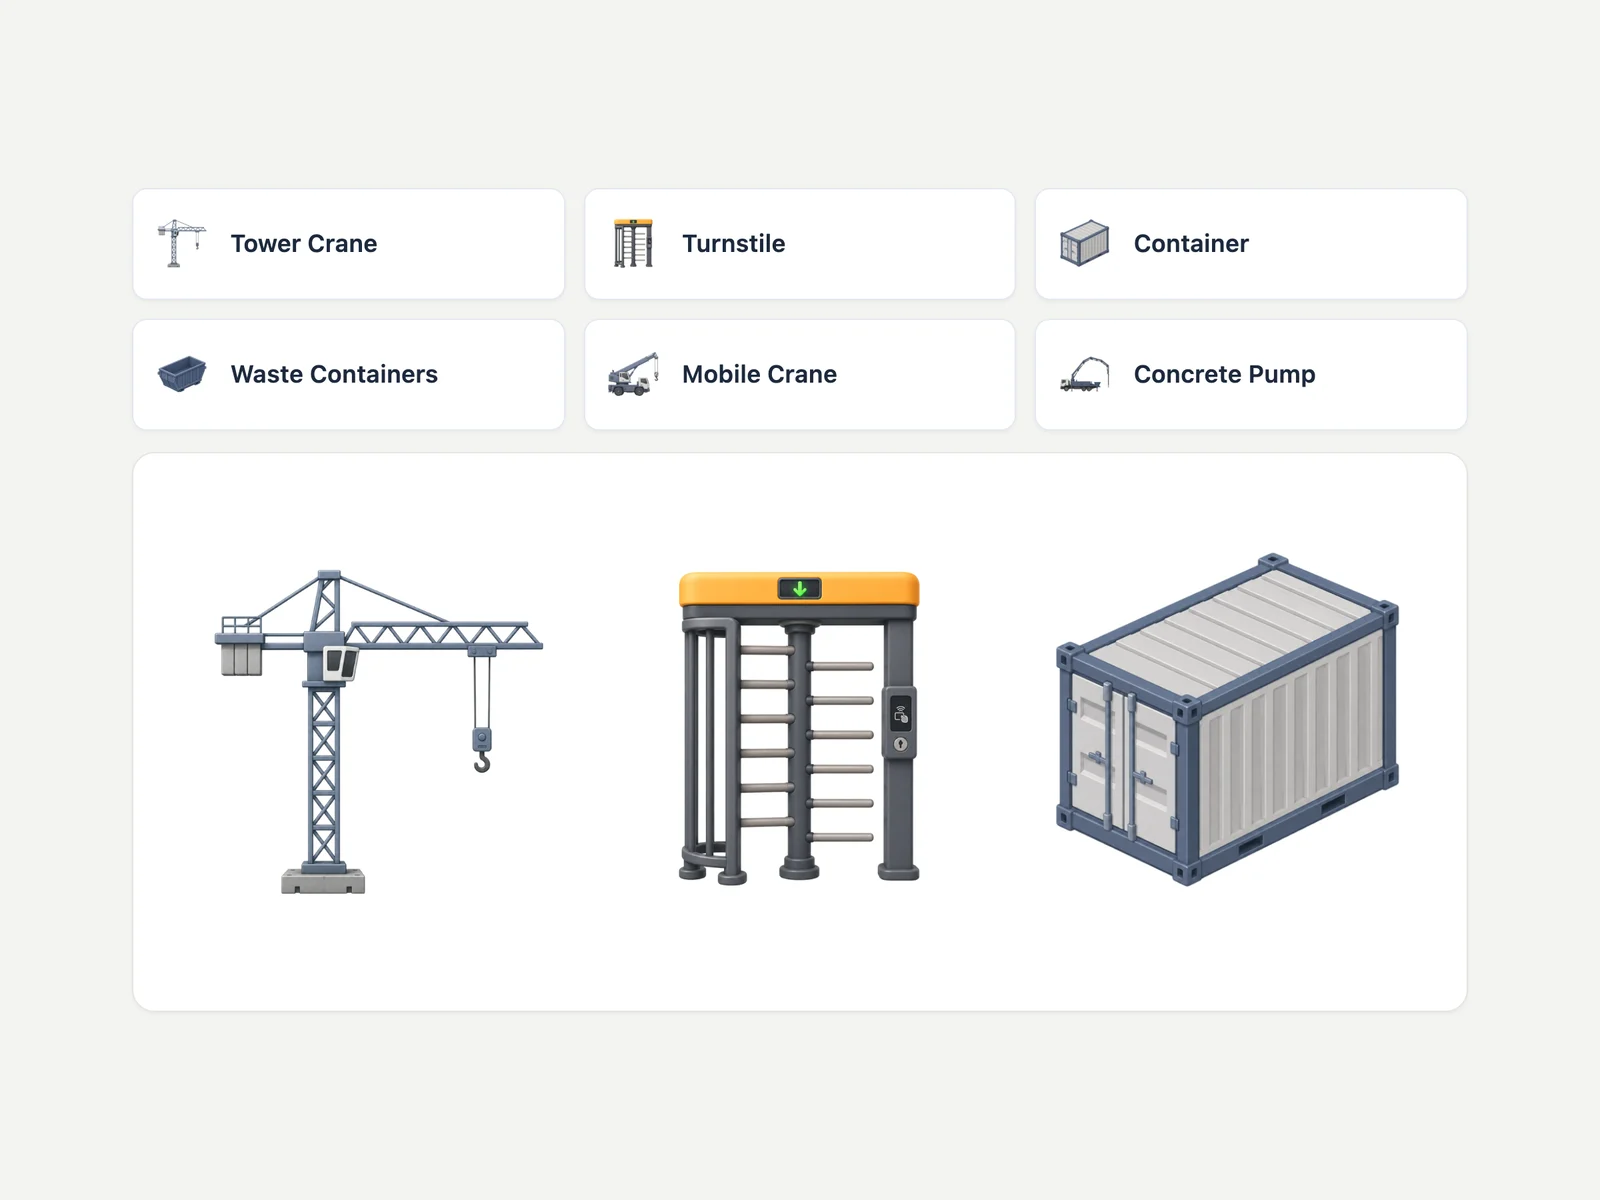
Illustrated site objects
Cranes, containers, gates and pumps are small illustrations. Each has a clear silhouette, so it is easy to find on a busy plan.

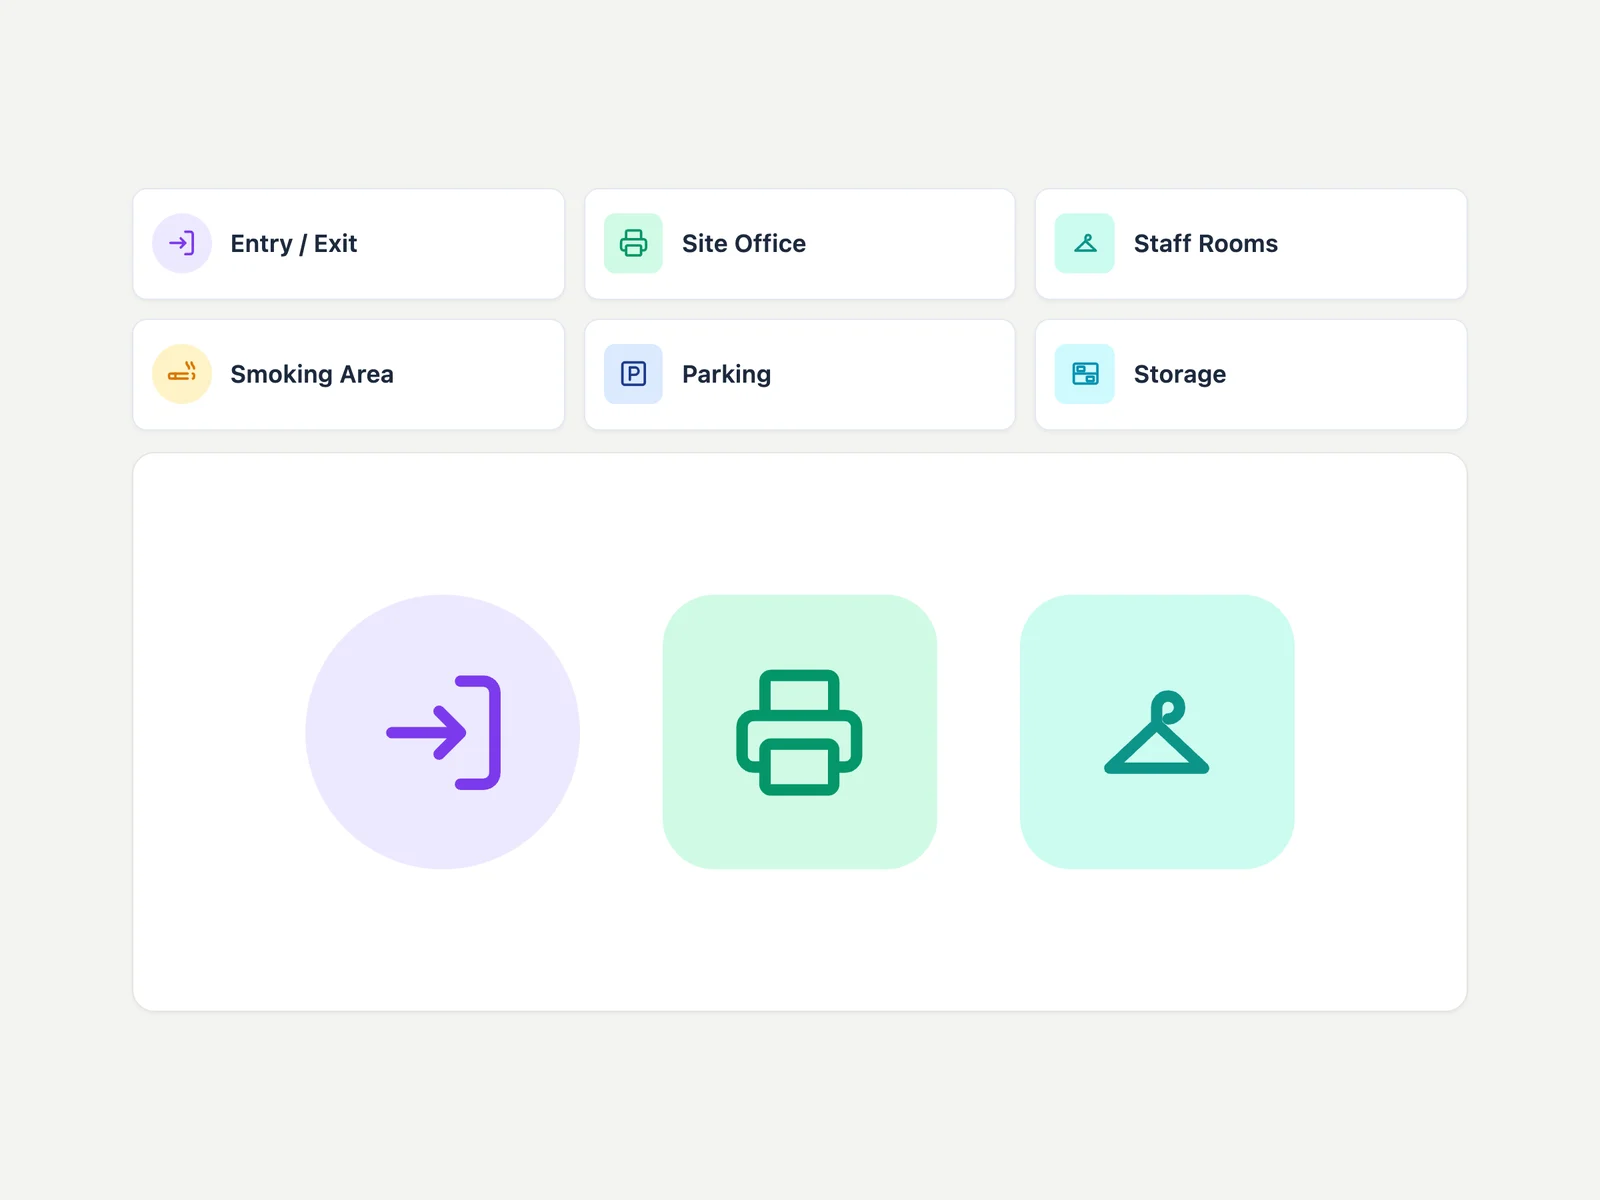
Plain icons
Simple icons for the rest. They sit well next to signs and illustrations, cover objects with no clear shape, and work as a fallback.

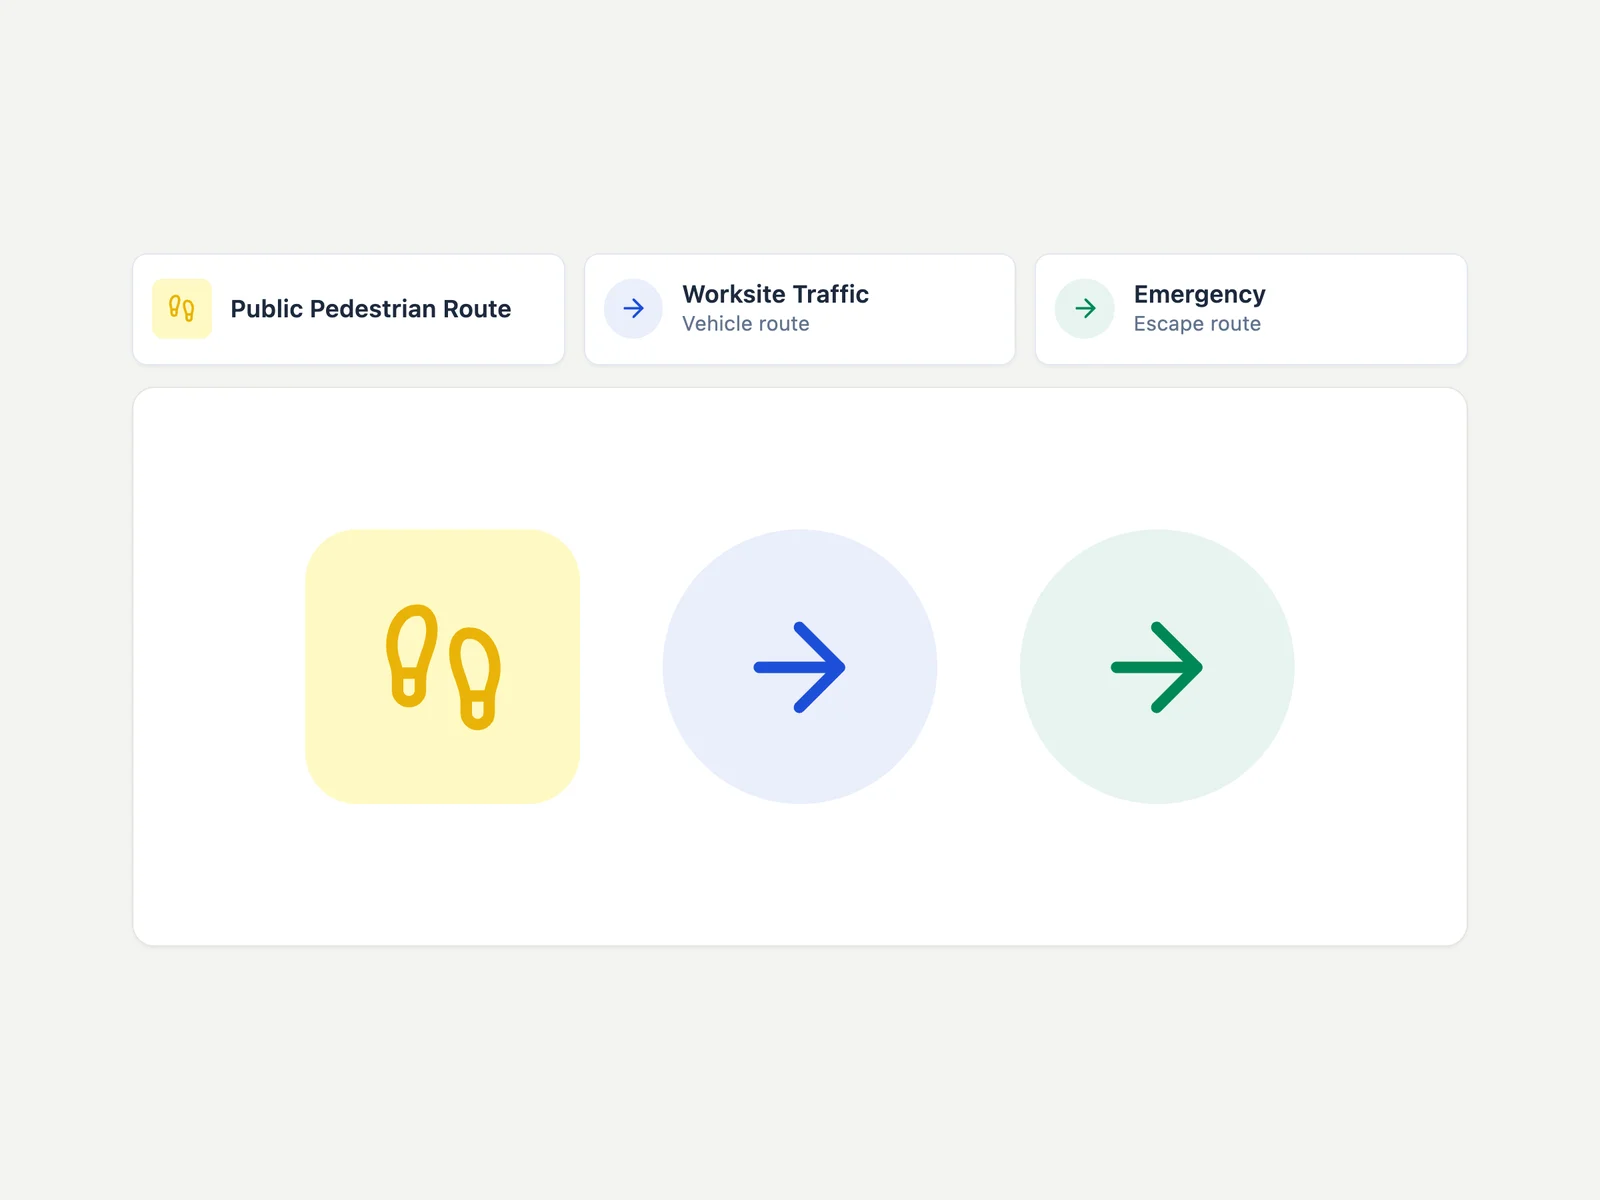
Routes
Pedestrian, vehicle and escape routes each have their own colour and line, so a worker can follow the one that is for them.
Result
Site plans are now self-service. The work used to sit with one person in our customer success team. Managers now make and update their own plans, and that person’s work on site plans dropped by roughly 90%.
The editor is being rolled out to clients step by step. About 40 site managers already use it, clients are happy and recommend it to each other, and it will reach every site. That means hundreds of managers, so the next step is to keep listening to what they ask for.
less work for customer success on site plans, now that managers make their own
Plans stay editable, and managers can print them. Some managers use the editor only for themselves, to bring a plan to their meetings.

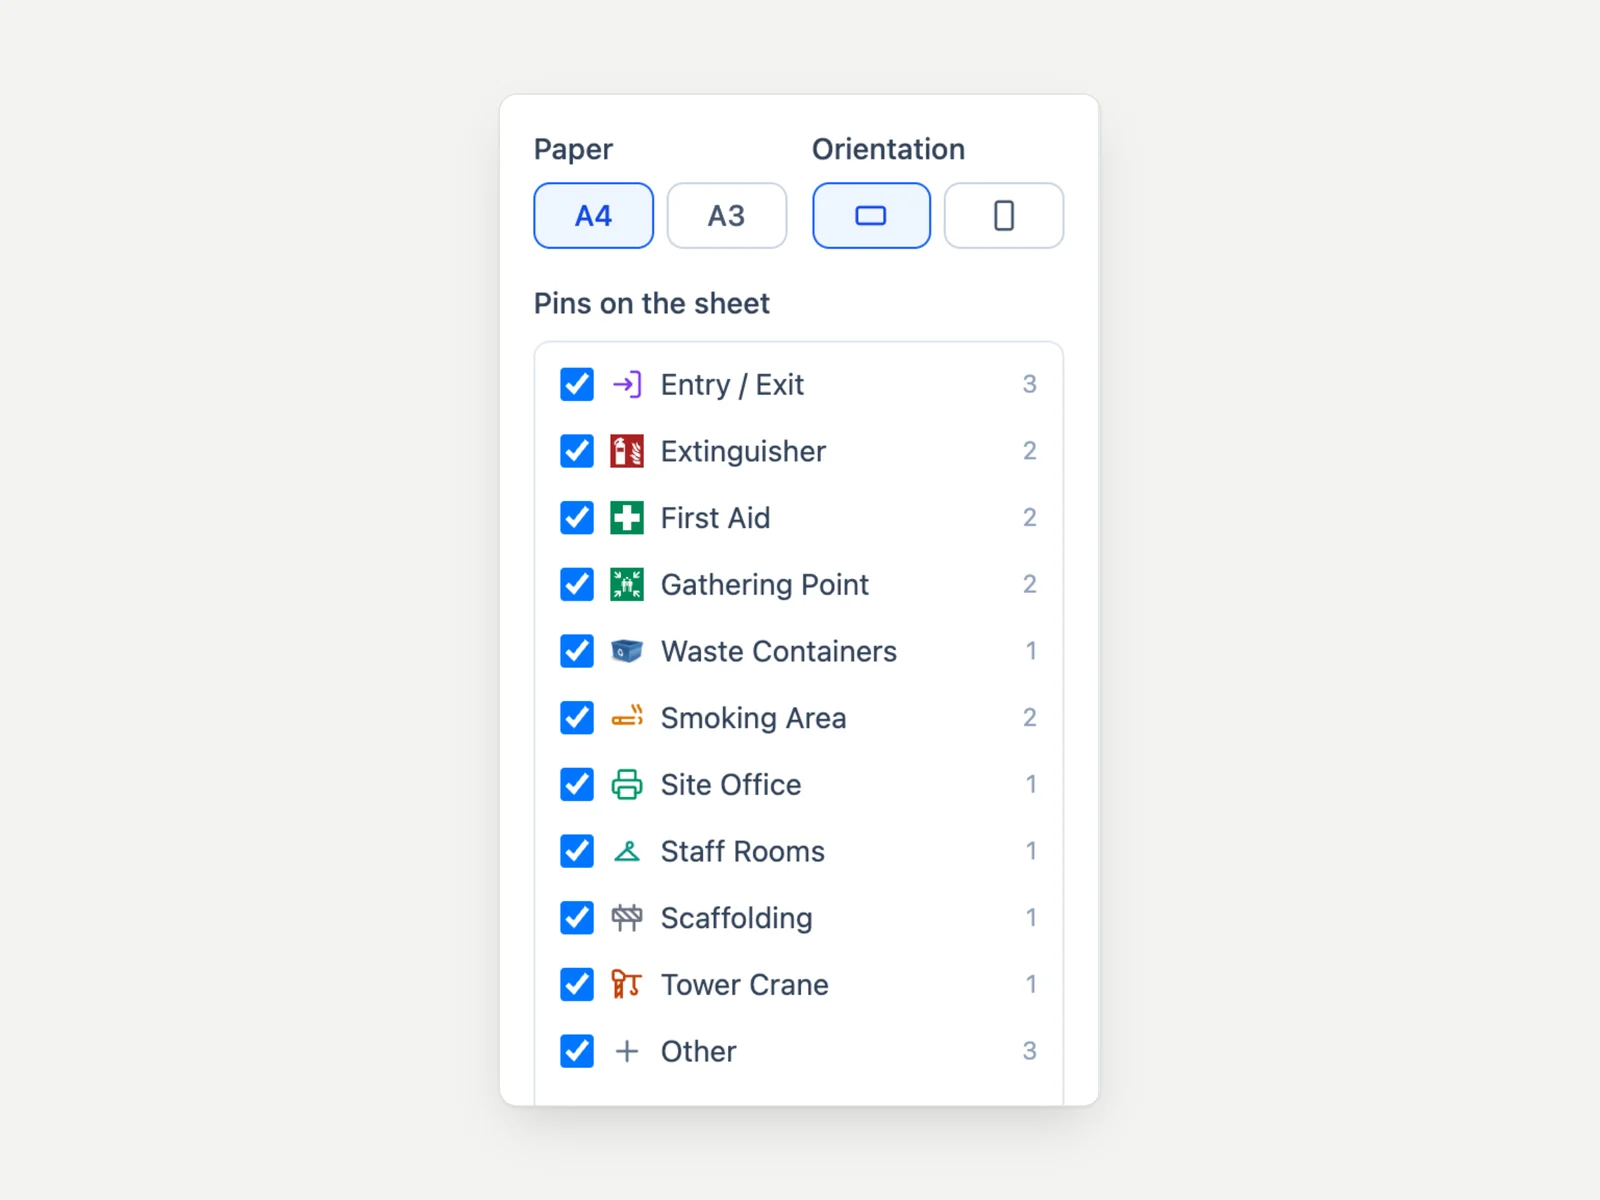
Print settings
A4 or A3, portrait or landscape. Managers choose which pins go on the sheet.

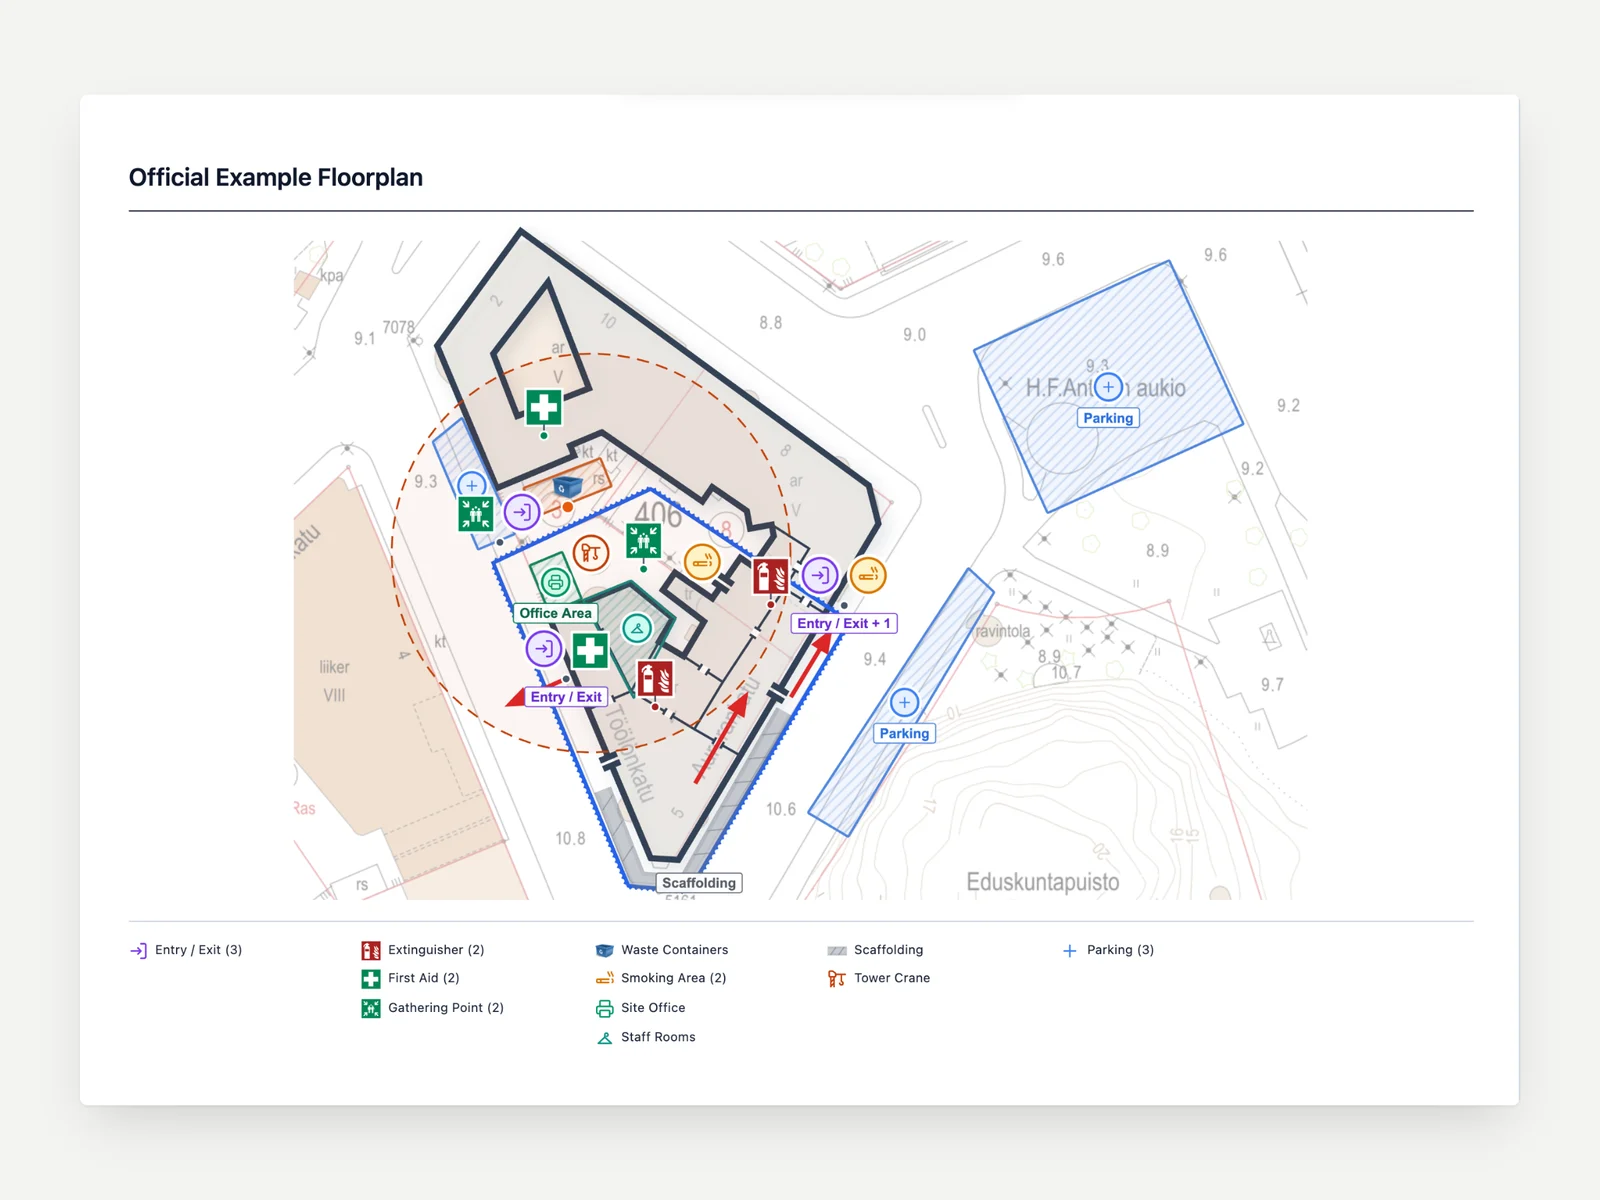
The printed sheet
The plan and its legend on one page, for the site office wall or a meeting.

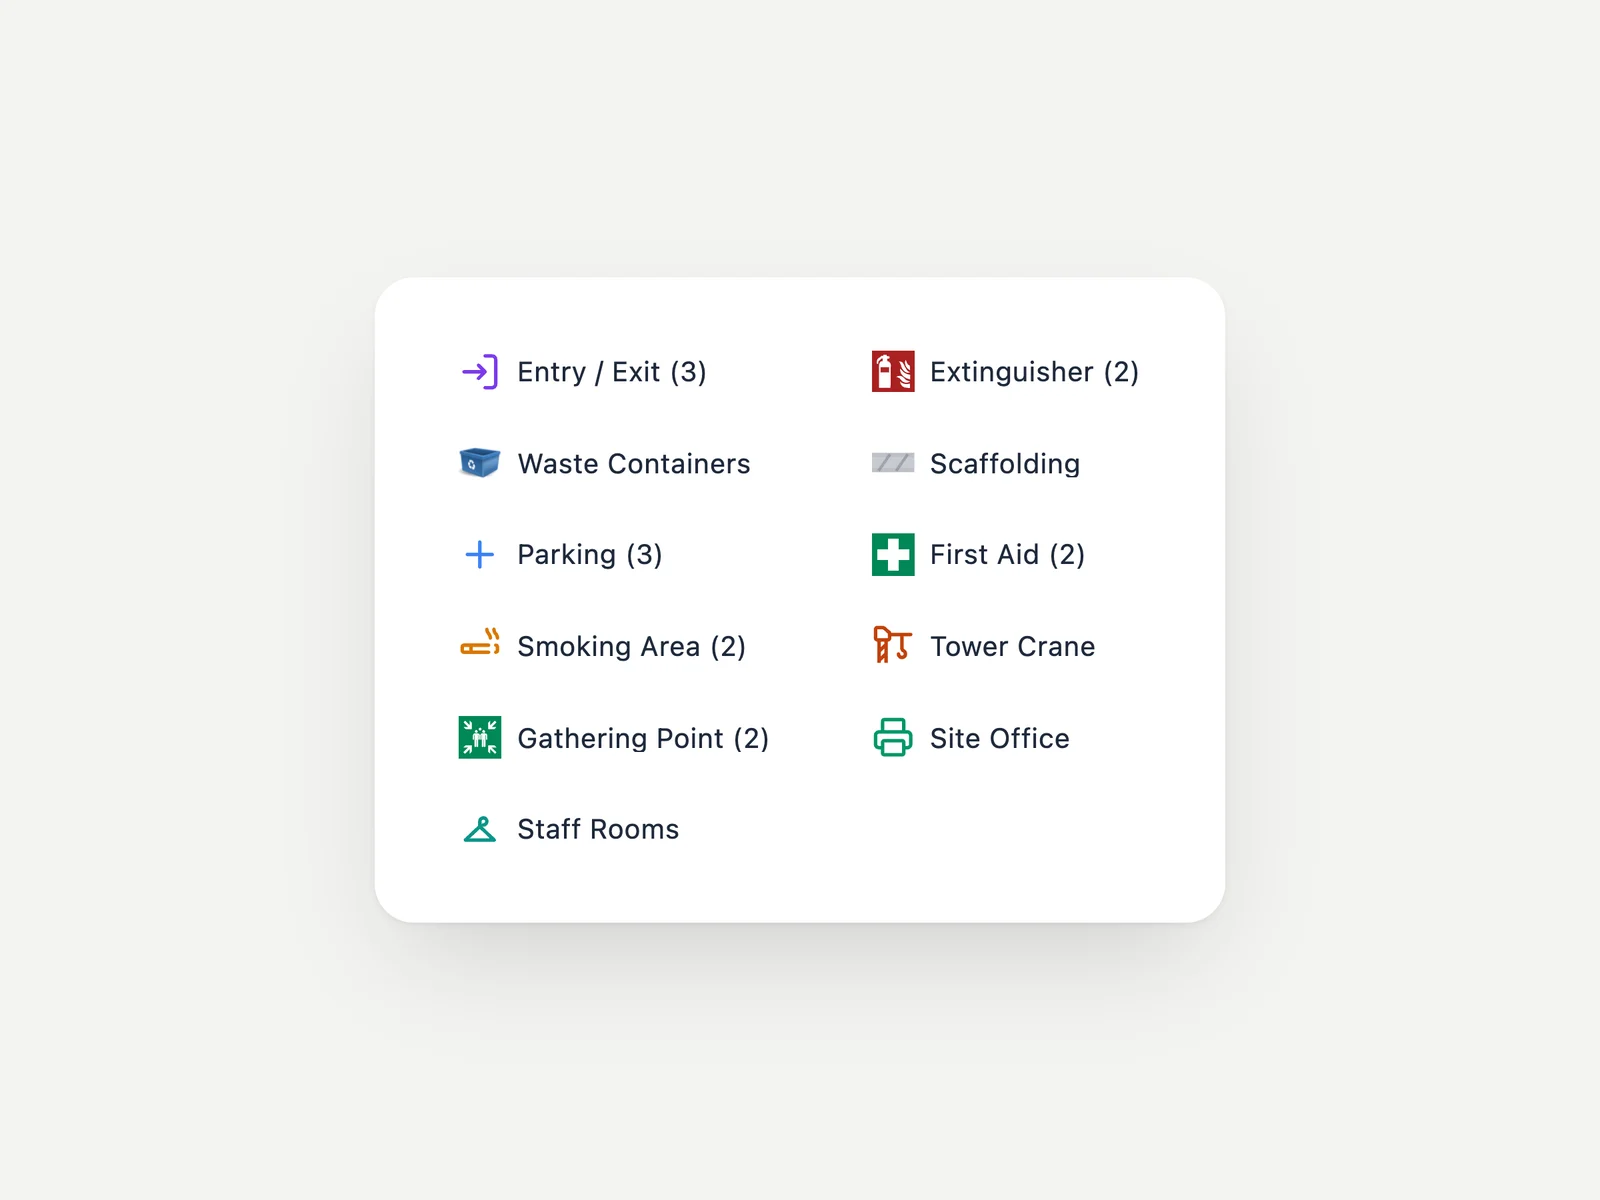
One legend everywhere
The sheet and the induction share one legend, with a count for each kind of marker.
In the induction
Workers step through the plan on their phone. Before it opens, the site address opens in their own map app.
In the induction, the plan opens in steps that follow a worker’s first day: arriving, safety, routes, the site office, then the work areas. The order came from talking to managers. The editor runs on its own and inside Raxalle. Inside Raxalle, the manager saves the plan to the site’s dashboard and picks which plan the induction shows.